Siemens Smart Solar Plant
SCADA System
Phase 4 elevates the fault-aware S7-1500 solar plant SCADA platform into a full telemetry historian environment by engineering a dedicated process trend logging architecture, multi-variable real-time graphing infrastructure, and a production-grade WinCC Advanced Historical Trends screen. The system now captures, retains, and visualises continuous time-series data across all critical plant parameters — solar irradiance, generation output, battery state of charge, and grid interaction flows — replicating the operational historian workflows deployed in utility-scale industrial energy monitoring systems.
Phase Objective
Phase 3 delivered a complete alarm management and plant protection layer with operator-driven fault injection and automated safe-state transitions. Phase 4 extends that foundation by introducing the process historian subsystem — the data retention and telemetry visualisation infrastructure that transforms an event-driven monitoring platform into a continuous operational analytics environment.
The primary engineering objective was to implement a production-representative process historian pipeline: structured trend tag mapping to live PLC data sources, multi-channel time-series graphing with independent scaling, SCADA-grade graph styling for operator readability, and architectural isolation of the Historical Trends screen from the existing SCADA overview and fault injection panels. The result is a fully integrated telemetry monitoring environment capable of tracking, displaying, and comparing plant variables across the full simulated operational timeline on every runtime execution cycle.
Software Environment
| Component | Technology |
|---|---|
| PLC Platform | Siemens S7-1500 (CPU 1511-1 PN) |
| Engineering Environment | TIA Portal V19 |
| Simulation Runtime | Siemens PLCSIM V19 |
| Programming Language | SCL (Structured Control Language) |
| HMI / SCADA Platform | WinCC Advanced Runtime (V19) |
| HMI Hardware Target | TP700 Comfort Panel (virtualised) |
| Historian Mechanism | WinCC Trend View Control — Online Trend |
Extended System Architecture — Phase 4
Phase 4 appends a dedicated process historian layer above the Phase 3 alarm management engine. The trend logging system operates passively — consuming live tag values from existing HMI tag bindings on every runtime cycle without introducing any new PLC-side execution overhead. The Historical Trends screen functions as a read-only telemetry consumer, drawing continuously from the established PLC data model without modifying control state or alarm conditions. This passive architecture ensures full decoupling between the historian and all upstream protection and energy routing logic.
Process Historian — Tracked Signal Register
Four primary plant telemetry channels were configured for continuous time-series acquisition and graphical presentation in the Historical Trends screen. Each channel is bound to an existing HMI tag with a direct PLC data source path — leveraging the full Phase 1–3 tag infrastructure without requiring additional PLC-side variable definitions.
| Trend Channel | HMI Tag Binding | Data Type | Physical Quantity | Operational Significance |
|---|---|---|---|---|
| Irradiance | Irradiance | Real | Solar irradiance (W/m²) | Primary weather input — drives all generation calculations |
| Solar kW | DB_Energy.PowerData.Generated.kW | Real (UDT_Power) | Active solar generation (kW) | Real-time photovoltaic output — correlates directly with irradiance |
| Battery SOC | Battery_SOC | Real | Battery state of charge (%) | BESS energy level — indicates charge/discharge cycle state |
| Grid Import / Export | GridImport / GridExport | Real | Grid power flow (kW) | Net grid interaction — confirms routing decision execution |
New System Components — Phase 4
WinCC Advanced — Historical Trends SCADA Screen
A dedicated process historian screen was engineered inside WinCC Advanced Runtime as an architecturally isolated SCADA view — separate from the Phase 2 energy overview screen and the Phase 3 fault injection panel. The screen hosts a full-width WinCC Trend View Control object configured for online trend acquisition, providing operators with continuous time-axis telemetry plots for all four monitored plant channels simultaneously. Screen isolation follows established industrial HMI design convention: historian views must remain operationally independent from control and alarm screens to prevent display interference during fault conditions.
- WinCC Trend View Control configured in Online mode — live continuous acquisition from PLC tag sources
- Multi-channel trend overlay: Irradiance (cyan), Solar kW (orange), Battery SOC (blue), Grid Import/Export (magenta) — colour-coded per channel for rapid operator differentiation
- Independent Y-axis scaling per channel — prevents high-magnitude irradiance values from compressing lower-amplitude power flow curves
- Time-axis cursor with per-channel value and timestamp readout in the tag table below the graph panel
- Full transport control bar: stop, rewind, fast-forward, zoom-in, zoom-out — consistent with IEC 62682 HMI navigation standards
- Trend line thickness increased from default to maximise readability on the TP700 virtualised display surface
- Graph grid density reduced — fewer horizontal division lines to eliminate visual clutter during multi-variable concurrent display
HMI Tag Architecture — Phase 4 Historian Bindings
Phase 4 introduced one additional HMI tag to the PLC_Alarm_Tags table: AlarmActive_HMI — a boolean binding to DB_Alarms.AlarmActive providing persistent alarm state visibility across all screens. All trend channel bindings reuse the existing Default tag table entries established in Phases 1–3, confirming the historian layer adds zero new PLC-side variables and operates purely as a read consumer of the established data model.
| HMI Tag Name | Tag Table | Type | PLC Source |
|---|---|---|---|
AlarmActive_HMI | PLC_Alarm_Tags [6] | Bool | DB_Alarms.AlarmActive |
Irradiance | Default tag table [16] | Real | PLC_1 — Irradiance |
DB_Energy.PowerData.Generat... | Default tag table [16] | UDT_Power | PLC_1 — DB_Energy |
Battery_SOC | Default tag table [16] | Real | PLC_1 — Battery_SOC |
GridImport / GridExport | Default tag table [16] | Real | PLC_1 — Grid tags |
Trend Visualisation — Signal Behaviour Analysis
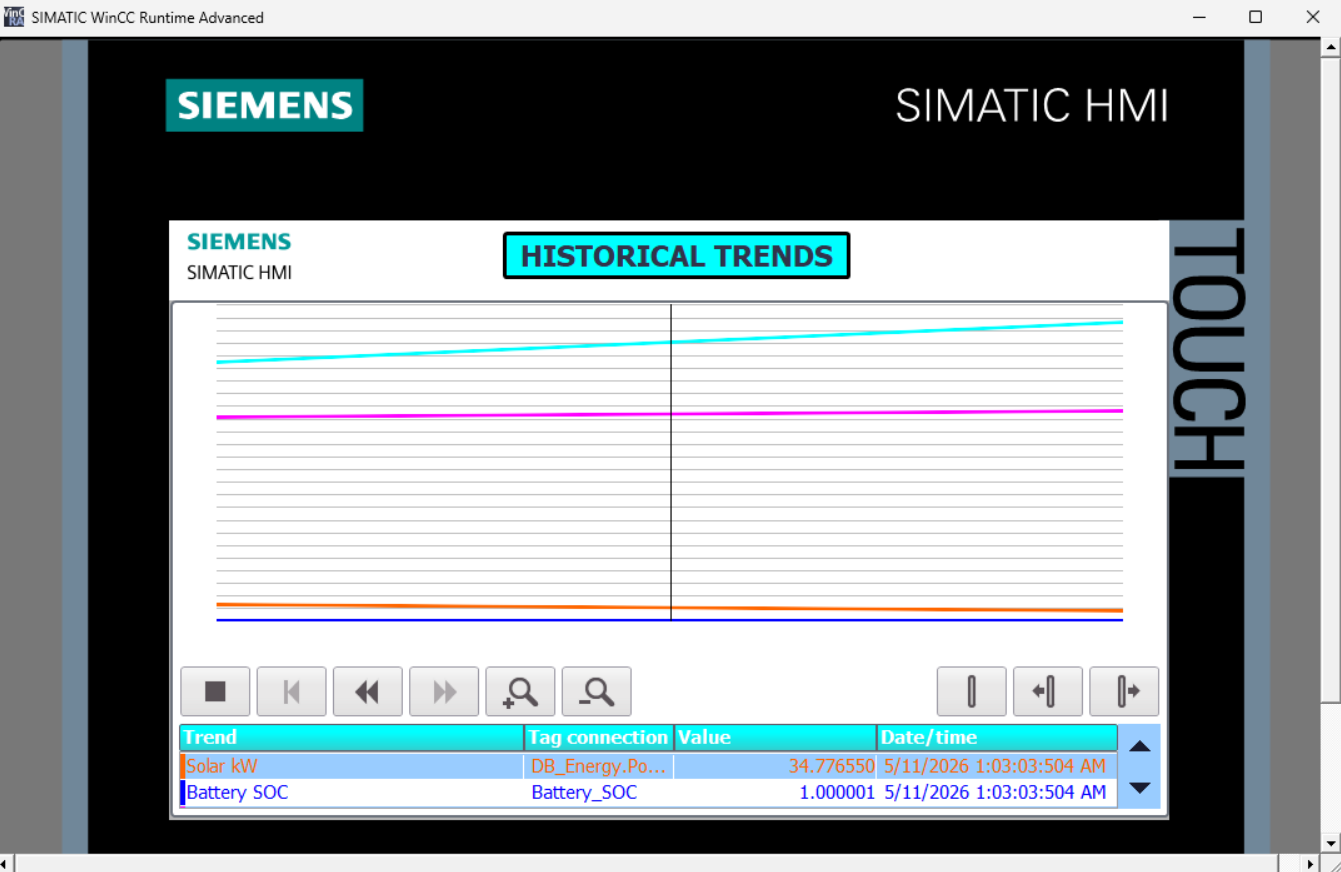
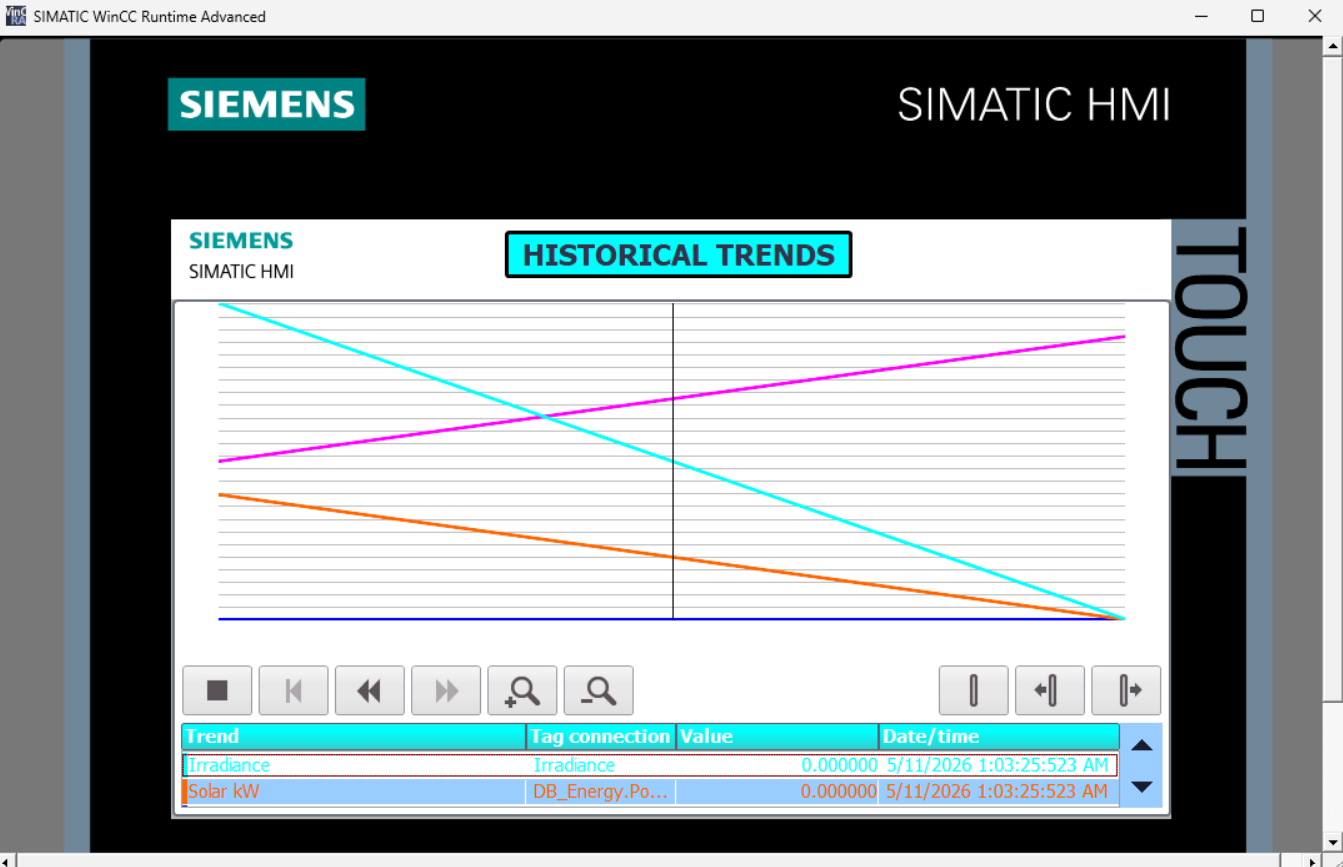
Two distinct operational scenarios were captured during Phase 4 commissioning, demonstrating the historian's ability to log and display divergent plant operating states across the simulation timeline. The trend graphs reveal physically coherent signal relationships — confirming that the underlying PLC simulation logic produces realistic renewable energy plant behaviour.
- Scenario A — Steady-State Generation: Solar kW (cyan) rising linearly as irradiance climbs, Battery SOC (blue) flat at maximum charge, grid export (magenta) stable — confirms peak-generation, battery-full, grid-export routing path executing correctly.
- Scenario B — Irradiance Collapse / Discharge: Irradiance (cyan) declining steeply to zero, Solar kW (orange) tracking irradiance to zero, Battery SOC (blue) flat at floor — confirms generation dropout and battery-exhausted state, grid import or load-shedding routing engaged.
WinCC Runtime Screenshots — Phase 4
Three operational screenshots captured from the live Phase 4 commissioning session: two trend view captures demonstrating distinct plant operating states across the simulation timeline, and one TIA Portal HMI tag editor view confirming the full Phase 4 tag architecture including the new PLC_Alarm_Tags [6] historian binding.
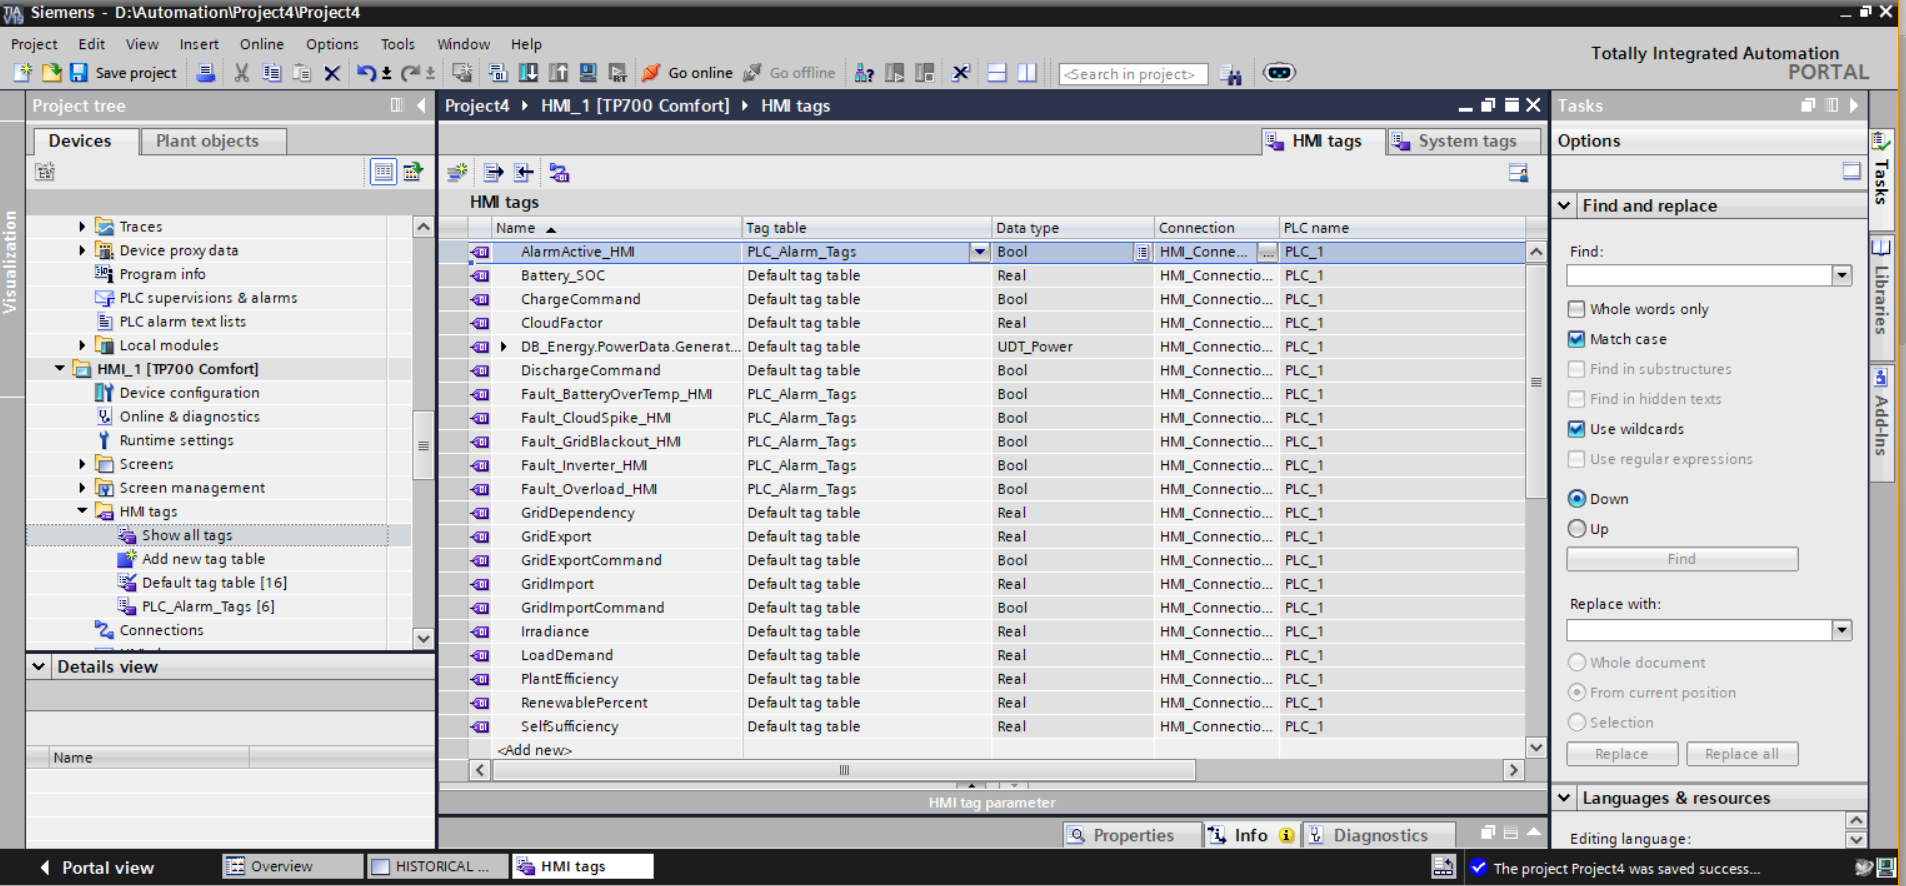
HMI_1 [TP700 Comfort] — Full Phase 4 tag architecture. AlarmActive_HMI (Bool, PLC_Alarm_Tags) confirmed as the Phase 4 addition — providing system-wide alarm state visibility across all SCADA screens. All five Phase 3 fault injection tags (Fault_BatteryOverTemp_HMI, Fault_CloudSpike_HMI, Fault_GridBlackout_HMI, Fault_Inverter_HMI, Fault_Overload_HMI) retained in PLC_Alarm_Tags [6]. Default tag table [16] carries all historian trend source tags: Battery_SOC, CloudFactor, DB_Energy.PowerData.Generat... (UDT_Power), DischargeCommand, GridDependency, GridExport, GridImport, GridImportCommand, Irradiance, LoadDemand, PlantEfficiency, RenewablePercent, SelfSufficiency. Project saved successfully — The project Project4 was saved successfully confirmed in status bar.
Virtual Commissioning & Runtime Status
All Phase 4 HMI configuration compiled to zero errors under TIA Portal V19. The WinCC Advanced project was synchronised with the PLCSIM CPU 1511-1 PN virtual runtime and launched in Runtime Advanced with all historian trend channels confirmed acquiring live data. The Historical Trends screen successfully rendered multi-variable time-series plots across both steady-state and transient operating scenarios within the commissioned simulation window.
Integration Issues & Resolutions
Four non-trivial engineering challenges were encountered and systematically diagnosed during Phase 4 implementation — each yielding reusable lessons applicable to production SCADA historian commissioning.
⚠ Issue 1 — Trend Variable Binding Failures on UDT_Power Tags
Binding the DB_Energy.PowerData.Generated UDT_Power compound type directly to a WinCC Trend View channel produced tag resolution errors at runtime — the Trend View Control requires scalar Real bindings, not structured UDT references. Attempting to bind the compound path without element-level resolution caused the channel to display no data.
Resolution: The tag binding path was resolved to the specific scalar member within the UDT structure, allowing WinCC to correctly dereference the Real value from the compound PLC data type. This confirmed the requirement to always resolve UDT bindings to their terminal scalar element when configuring Trend View channels.
⚠ Issue 2 — Trend Lines Indistinguishable at Default Styling
With default WinCC Trend View styling applied, all four trend channels rendered at 1px line weight on the TP700 display surface. At the standard grid density and zoom level, channels overlapping in similar value ranges became visually indistinguishable — compromising operator readability during multi-variable concurrent display.
Resolution: Line thickness was increased across all channels and distinct, high-contrast colours were assigned per channel: cyan (irradiance), orange (solar kW), blue (battery SOC), magenta (grid interaction). Grid line density was reduced by increasing horizontal division spacing, producing a cleaner trend surface with adequate visual separation between channels.
⚠ Issue 3 — Runtime Communication Interruptions During Trend Acquisition
During extended simulation runs, intermittent PLCSIM-to-WinCC communication dropouts caused trend acquisition gaps — producing flat segments in active channels without corresponding real plant conditions. Root cause: the PLCSIM virtual runtime periodically dropped the PN/IE connection during high CPU load periods within the virtualised environment.
Resolution: Simulation runtime was restarted and HMI connection re-established following each dropout event. Trend acquisition resumed automatically upon reconnection. This identified PLCSIM virtual communication stability as an environmental constraint of the virtualised commissioning platform — documented for Phase 5 planning.
⚠ Issue 4 — Y-Axis Scale Compression Masking Low-Amplitude Channels
With a unified Y-axis scale applied across all trend channels, the high-magnitude irradiance values (0–1000 W/m² range) dominated the graph vertical extent — compressing Battery SOC (0–1.0 range) and power flow channels into a nearly flat band at the bottom of the plot area, effectively rendering them unreadable.
Resolution: Independent Y-axis scaling was configured per trend channel, allowing each channel to occupy the full graph height relative to its own engineering unit range. This restored full readability for all channels simultaneously and is consistent with standard industrial multi-parameter historian display practice.
Engineering Lessons — Phase 4
✔ Process Historians Must Be Architecturally Decoupled from Control Logic
Positioning the Historical Trends screen as a passive, read-only tag consumer — without introducing any new PLC-side variables or modifying existing execution blocks — confirmed the correct architectural boundary between telemetry historian and plant control systems. In production SCADA environments, historian layers must never introduce write paths into control data blocks; doing so creates race conditions between historian logging operations and real-time control execution. Read-only tag consumption with isolated screen architecture is the correct pattern at every scale.
✔ Multi-Variable Trend Displays Demand Deliberate Visual Engineering
Default WinCC Trend View styling is insufficient for production-grade multi-channel displays. Line weight, colour assignment, axis scaling, and grid density each require deliberate engineering decisions — not acceptance of tool defaults. The distinction between an operator-readable trend display and an indecipherable line cluster is entirely a function of styling discipline. Industrial SCADA HMI design standards (ISA-101) mandate that trend displays be optimised for rapid signal differentiation under time-pressured operating conditions — a requirement that default tool aesthetics routinely fail to satisfy.
✔ Telemetry Captures Reveal Simulation Fidelity
The two captured trend scenarios — steady-state generation and irradiance collapse — produced physically coherent signal relationships that directly reflect the causal logic embedded in Phases 1–3: irradiance drives generation, generation state governs battery routing, battery state governs grid interaction. The historian did not merely log numbers — it produced a verifiable record of simulation causality. This confirmed that the Phase 1–3 simulation architecture produces physically realistic plant behaviour, validating the energy routing and weather engine logic without requiring manual DB interrogation on every test cycle.
✔ Tag Table Discipline Scales Cleanly Across Multi-Phase Projects
Maintaining strict separation between the Default tag table (process data, 16 entries) and PLC_Alarm_Tags (alarm and protection flags, 6 entries) across Phases 3 and 4 produced a tag architecture with zero naming conflicts, clear ownership boundaries, and unambiguous HMI binding paths. As the project scales toward Phase 5 and beyond, this structured tag table discipline will prevent the tag namespace collisions and ownership ambiguity that are the primary source of HMI integration failures in large multi-phase industrial projects.
✔ Independent Y-Axis Scaling Is Non-Negotiable for Mixed-Engineering-Unit Displays
Applying a single unified Y-axis scale to channels with fundamentally different engineering unit magnitudes is an HMI design failure — not a styling preference. A shared axis that accommodates irradiance (0–1000 W/m²) will render battery SOC (0–1.0) as a flat line indistinguishable from zero. Independent per-channel scaling is a correctness requirement, not an enhancement — and its absence in initial configuration is a repeatable commissioning pitfall that must be caught during trend view setup, not discovered during operator acceptance testing.
Phase 4 System Capabilities
- Acquires and visualises continuous time-series telemetry across four independent plant signal channels in real time
- Renders multi-variable trend overlays with colour-coded channel differentiation and independent Y-axis scaling per engineering unit range
- Provides operator-accessible time cursor with per-channel value and timestamp readout at sub-second resolution
- Captures and persists divergent operating scenarios — steady-state generation and irradiance collapse — within a single historian runtime session
- Exposes complete transport control navigation: stop, rewind, fast-forward, zoom-in, zoom-out — consistent with IEC 62682 HMI standards
- Integrates historian acquisition passively into the existing Phase 1–3 data model — zero new PLC-side variables, zero disruption to control or alarm logic
- Extends the HMI tag architecture to 22 total tags across two structured tag tables: Default [16] and PLC_Alarm_Tags [6]
- Adds cross-screen
AlarmActive_HMIboolean visibility — alarm state persistent across all three SCADA screens - Operates entirely within the PLCSIM virtualised commissioning environment — no physical hardware required
- Produces verifiable simulation fidelity evidence: trend data confirms physically coherent causal relationships between irradiance, generation, battery SOC, and grid interaction
Development Roadmap
✅ Phase 1 — Core Simulation
Weather engine, solar generation, BESS, grid manager, PLCSIM virtual commissioning. Complete.
✅ Phase 2 — Advanced Energy Management
Dynamic load demand, intelligent energy routing, efficiency KPIs, WinCC Advanced SCADA HMI. Complete.
✅ Phase 3 — Alarm & Fault Management
Centralised alarm database, FB_AlarmManager, fault injection panel, safe-state protection, WinCC annunciation. Complete.
📈 Phase 4 — Historical Trends
Process historian, multi-channel WinCC Trend View, live telemetry visualisation, SCADA reporting screen. Complete.
Phase 5 — Hybrid Microgrid
Wind turbine simulation, diesel generator backup logic, automatic transfer switching and source priority management.
Phase 6 — Advanced Control
Full plant state machines, PID thermal regulation, predictive energy optimisation, operational recipes.