Siemens Smart Solar Plant
SCADA System
Phase 2 extends the virtualised renewable energy platform into a fully operational intelligent energy management system — integrating dynamic load demand modelling, adaptive energy routing, battery dispatch logic, real-time KPI computation, and a live WinCC Advanced HMI dashboard. All subsystems are orchestrated through structured SCL function blocks executing on a virtualised S7-1500 runtime under Siemens TIA Portal V19.
Phase Objective
Phase 1 established the core simulation and energy generation architecture. Phase 2 transforms that static monitoring foundation into a responsive, decision-making system capable of dynamic energy routing — evaluating real-time solar generation, plant load demand, battery state of charge, and grid availability to autonomously determine the optimal energy distribution strategy on every PLC scan cycle.
The primary deliverable is a fully operational SCADA HMI screen running in WinCC Advanced Runtime, displaying live plant telemetry, animated energy flow indicators, renewable contribution tracking, and industrial-grade KPI metrics — consistent with the visualisation layer of a real solar utility installation.
Software Environment
| Component | Technology |
|---|---|
| PLC Platform | Siemens S7-1500 (CPU 1511-1 PN) |
| Engineering Environment | TIA Portal V19 |
| Simulation Runtime | Siemens PLCSIM V19 |
| Programming Language | SCL (Structured Control Language) |
| HMI / SCADA Platform | WinCC Advanced Runtime (V19) |
| HMI Hardware Target | TP700 Comfort Panel (virtualised) |
Expanded System Architecture
Phase 2 introduces three new functional layers above the Phase 1 energy core. Dynamic load demand feeds the energy router, which in turn drives real-time grid command resolution before efficiency metrics are computed — enforcing strict data dependency ordering within the PLC scan cycle.
Phase 2 Program Block Structure
Three new function blocks and one inline SCL network were added to the Main [OB1] execution sequence. Block ordering is critical — energy routing must resolve grid commands before the efficiency metrics block executes to avoid zero-value outputs caused by stale data.
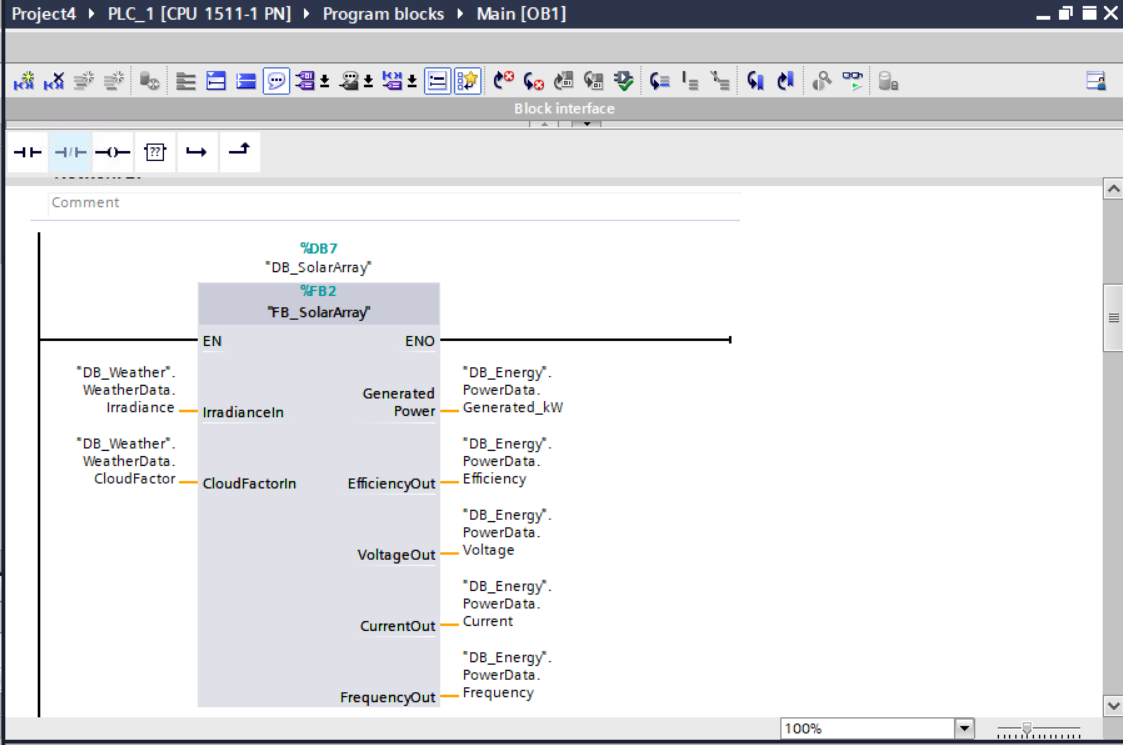
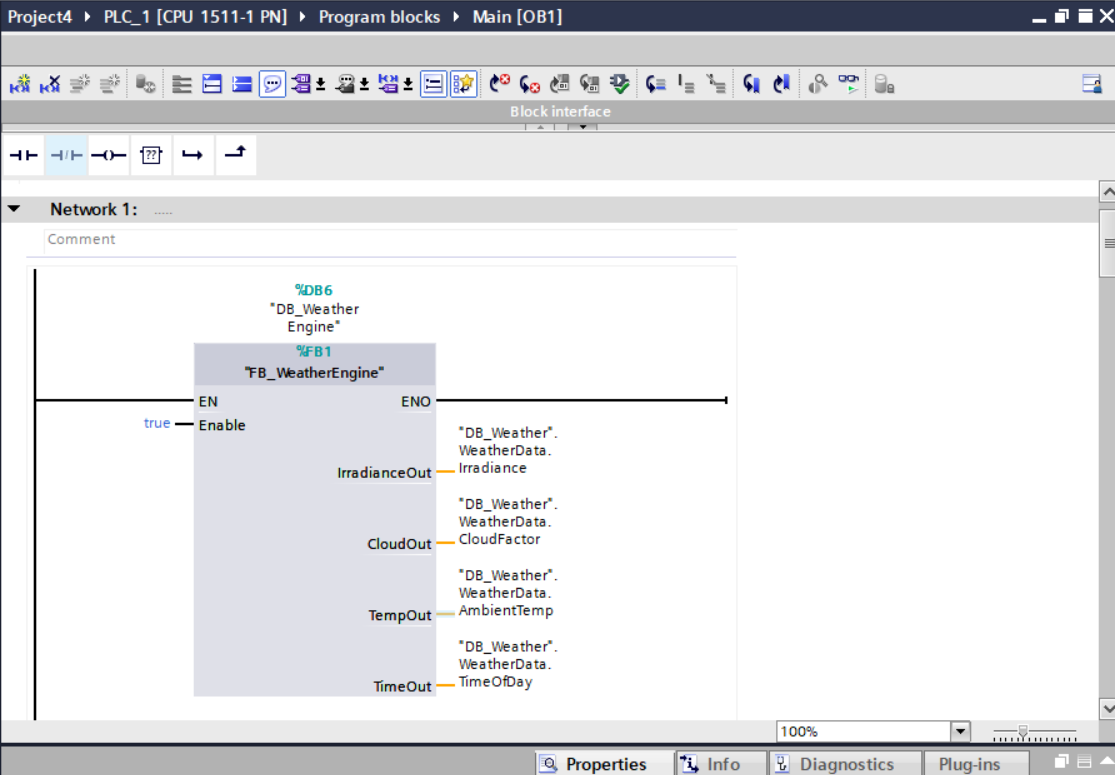
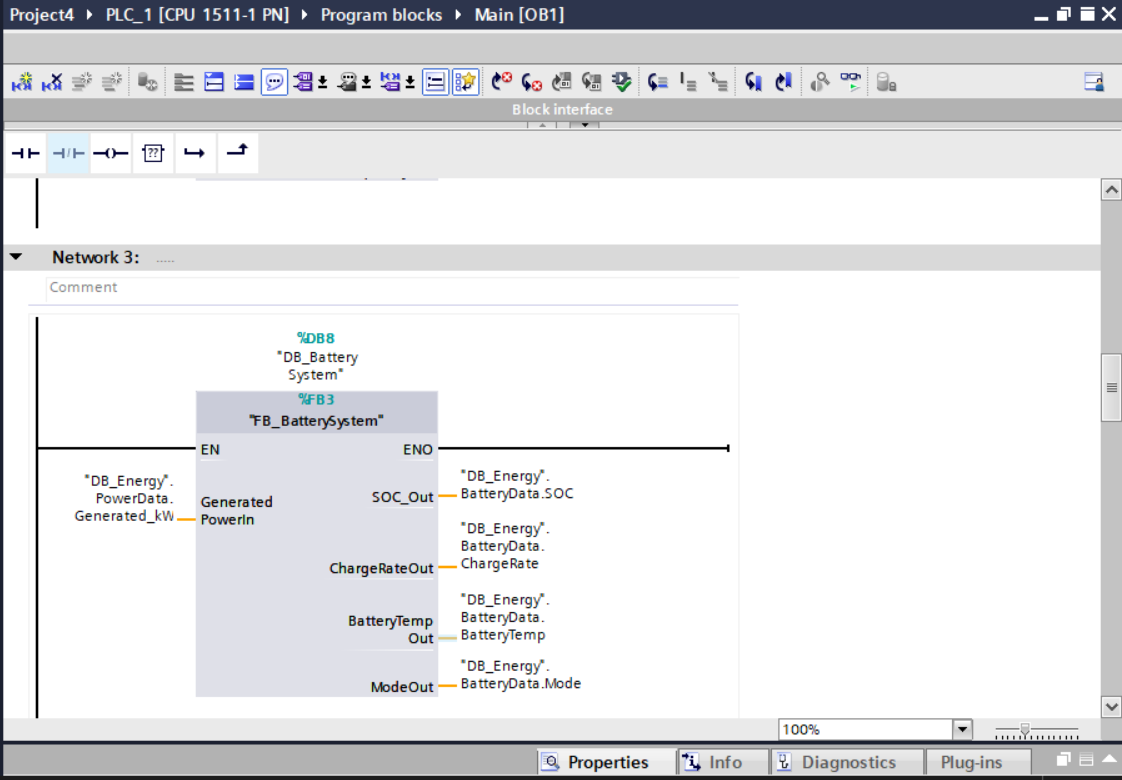
Network 1  — FB_WeatherEngine   [FB1 / DB6]  — Phase 1
Network 2  — FB_SolarArray      [FB2 / DB7]  — Phase 1
Network 3  — FB_BatterySystem   [FB3 / DB8]  — Phase 1
Network 4  — FB_LoadDemand      [FB5 / DB12] — Phase 2 ★
Network 5  — FB_EnergyRouter    [FB6 / DB13] — Phase 2 ★
Network 6  — Grid SCL Resolution             — Phase 2 ★
Network 7  — FB_EfficiencyMetrics [FB7/DB14] — Phase 2 ★
New Function Block Architecture — Phase 2
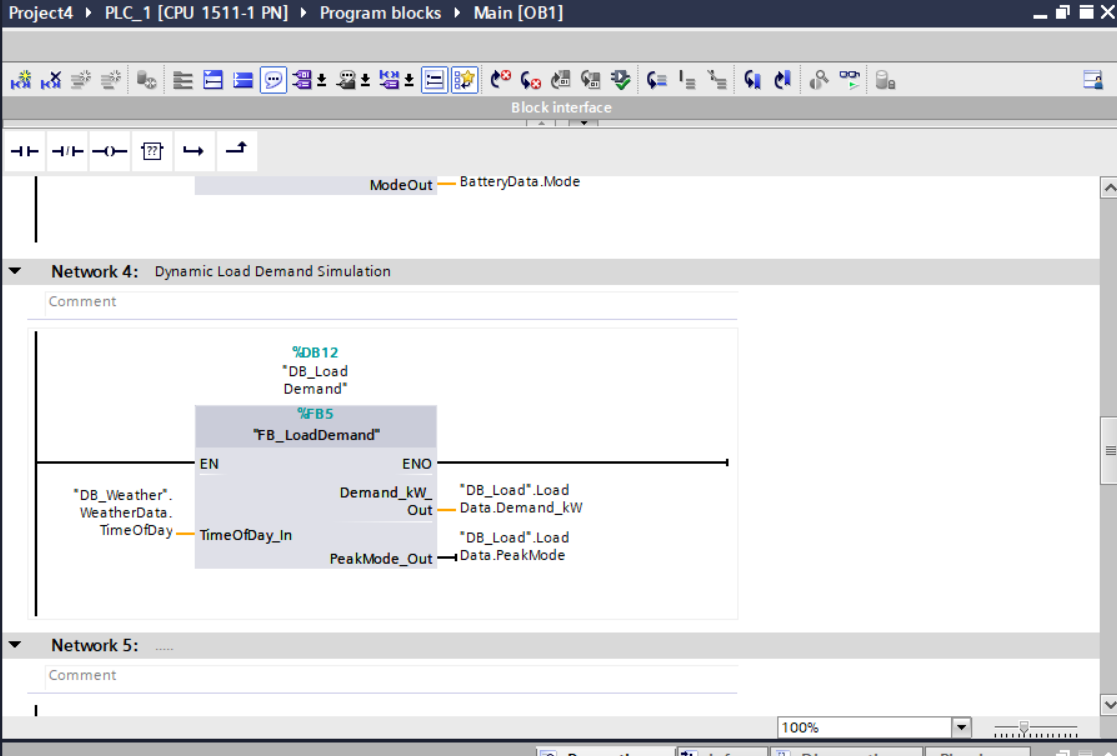
FB_LoadDemand [FB5 / DB12] — Dynamic Plant Load Simulation
Simulates a variable plant consumption profile keyed to the simulated time-of-day, replicating realistic industrial load curves including peak demand periods. The block consumes DB_Weather.WeatherData.TimeOfDay and outputs a continuously varying Demand_kW value alongside a boolean PeakMode flag — allowing downstream routing logic to apply peak-demand prioritisation strategies.
- Input:
TimeOfDay_In— sourced fromDB_Weather.WeatherData.TimeOfDay - Output:
Demand_kW_Out→DB_Load.LoadData.Demand_kW - Output:
PeakMode_Out→DB_Load.LoadData.PeakMode - Instance DB:
DB_Load_Demand [DB12]
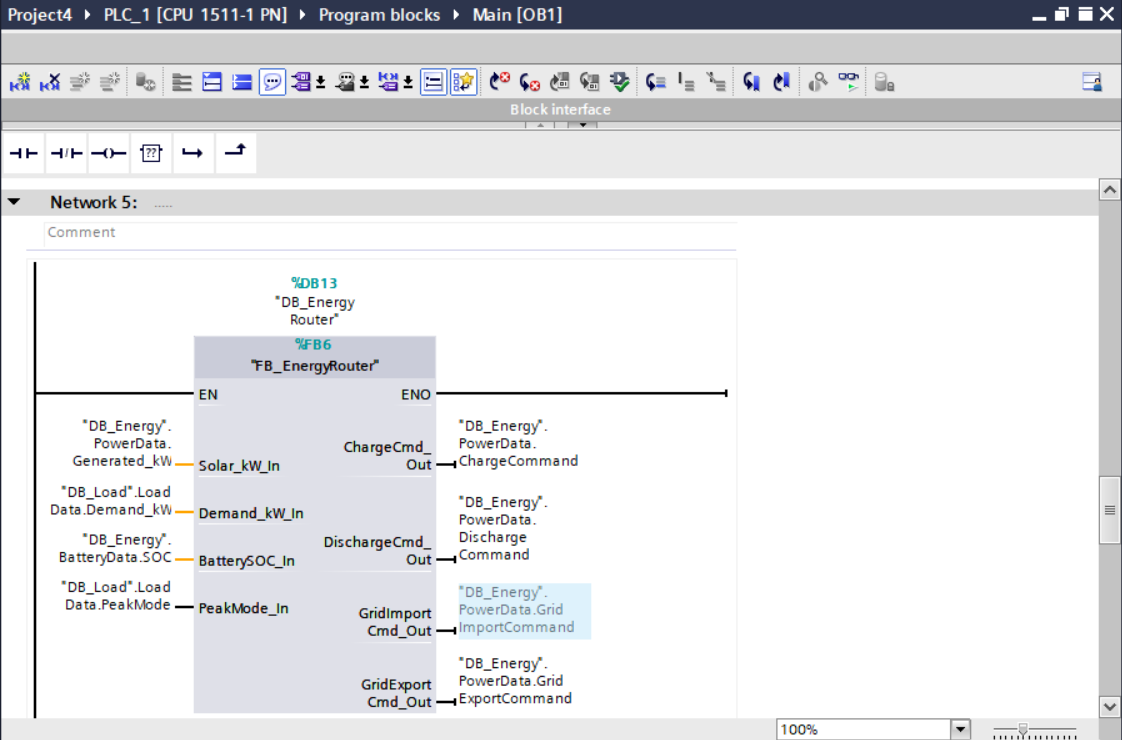
FB_EnergyRouter [FB6 / DB13] — Intelligent Energy Distribution Engine
The central decision-making block of the Phase 2 system. On every PLC scan, the router evaluates four live inputs — solar generation, plant demand, battery SOC, and peak mode status — and resolves the optimal energy routing strategy, issuing boolean command outputs that drive grid import, grid export, battery charge, and battery discharge operations. This single block replaces and supersedes the legacy FB_GridManager, consolidating all energy distribution authority into one deterministic control source.
- Input:
Solar_kW_In— fromDB_Energy.PowerData.Generated_kW - Input:
Demand_kW_In— fromDB_Load.LoadData.Demand_kW - Input:
BatterySOC_In— fromDB_Energy.BatteryData.SOC - Input:
PeakMode_In— fromDB_Load.LoadData.PeakMode - Output:
ChargeCmd_Out→DB_Energy.PowerData.ChargeCommand - Output:
DischargeCmd_Out→DB_Energy.PowerData.DischargeCommand - Output:
GridImportCmd_Out→DB_Energy.PowerData.GridImportCommand - Output:
GridExportCmd_Out→DB_Energy.PowerData.GridExportCommand
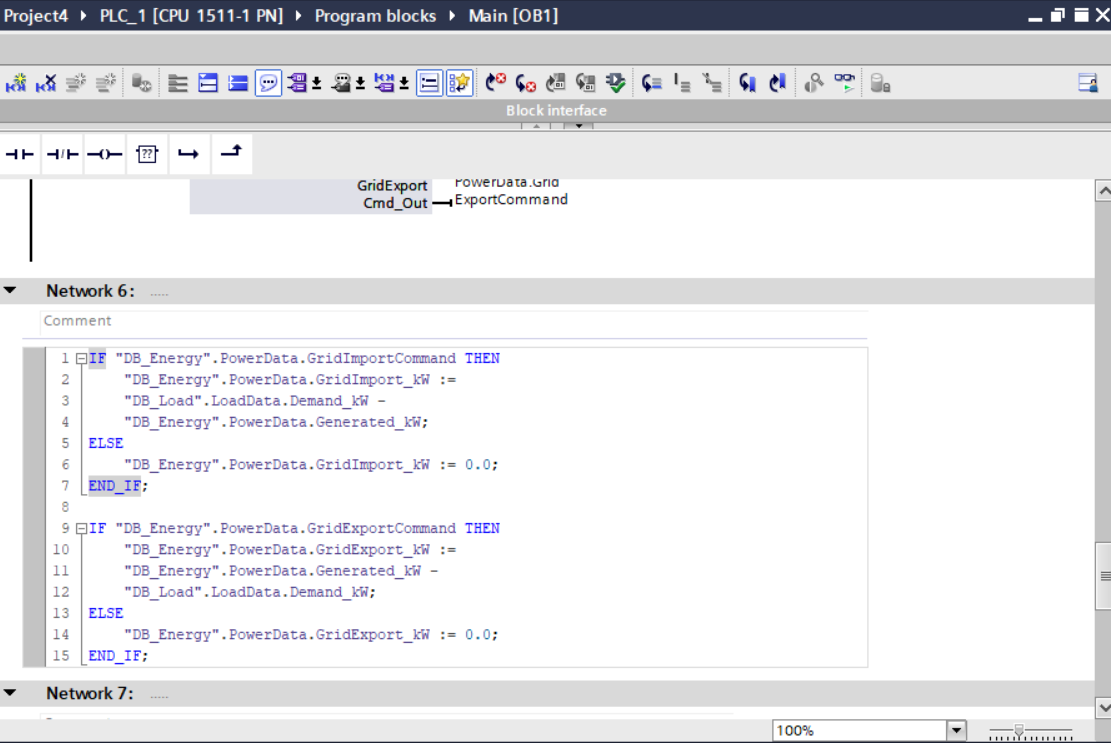
Network 6 — Inline Grid Command Resolution [SCL]
Translates the boolean command outputs from FB_EnergyRouter into quantified power flow values. This inline SCL block reads the active grid commands and computes actual kilowatt values — import as the deficit between demand and generation, export as the surplus above demand. Executed immediately after the router and before the metrics block to guarantee that resolved values are available for efficiency calculations within the same scan cycle.
IF "DB_Energy".PowerData.GridImportCommand THEN
    "DB_Energy".PowerData.GridImport_kW :=
    "DB_Load".LoadData.Demand_kW -
    "DB_Energy".PowerData.Generated_kW;
ELSE
    "DB_Energy".PowerData.GridImport_kW := 0.0;
END_IF;

IF "DB_Energy".PowerData.GridExportCommand THEN
    "DB_Energy".PowerData.GridExport_kW :=
    "DB_Energy".PowerData.Generated_kW -
    "DB_Load".LoadData.Demand_kW;
ELSE
    "DB_Energy".PowerData.GridExport_kW := 0.0;
END_IF;
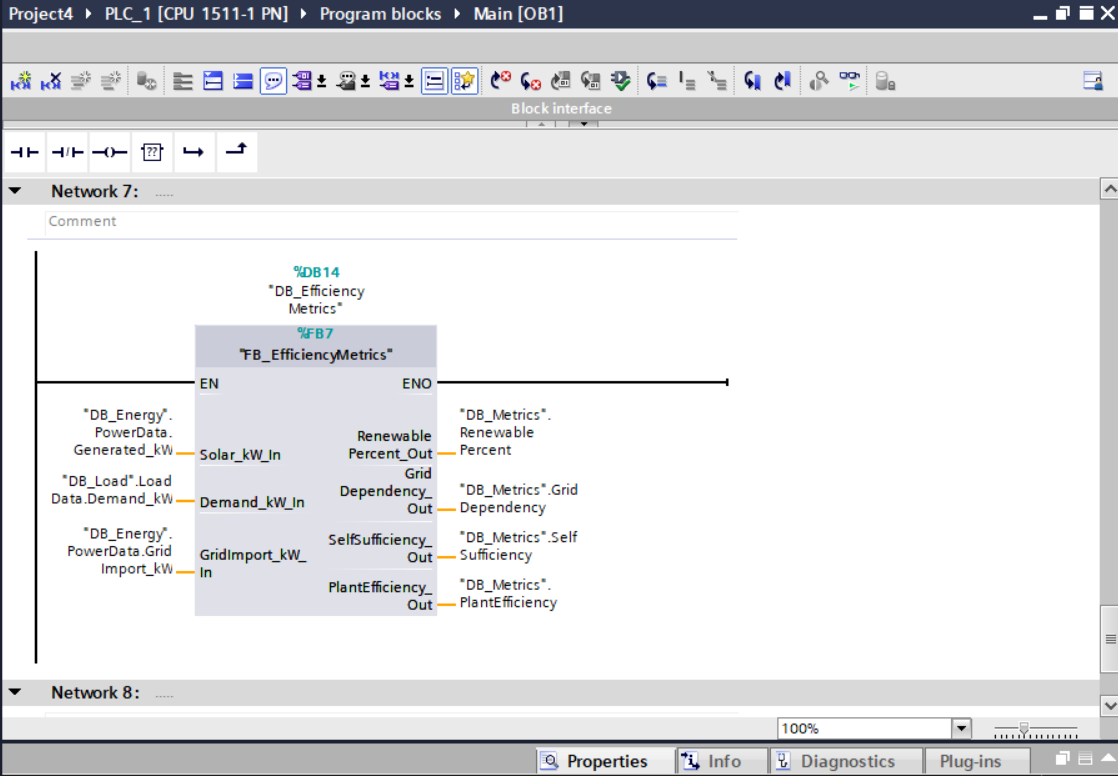
FB_EfficiencyMetrics [FB7 / DB14] — Real-Time KPI Computation Engine
Computes four plant-wide performance indicators on every scan cycle, sourcing resolved power flow values from upstream blocks. Outputs are written to a dedicated DB_Metrics data block and bound directly to WinCC HMI display fields, providing operators with live renewable contribution percentages and grid dependency ratios consistent with industrial SCADA energy dashboards.
- Input:
Solar_kW_In— fromDB_Energy.PowerData.Generated_kW - Input:
Demand_kW_In— fromDB_Load.LoadData.Demand_kW - Input:
GridImport_kW_In— fromDB_Energy.PowerData.GridImport_kW - Output:
RenewablePercent_Out→DB_Metrics.RenewablePercent - Output:
GridDependency_Out→DB_Metrics.GridDependency - Output:
SelfSufficiency_Out→DB_Metrics.SelfSufficiency - Output:
PlantEfficiency_Out→DB_Metrics.PlantEfficiency
WinCC Advanced SCADA HMI
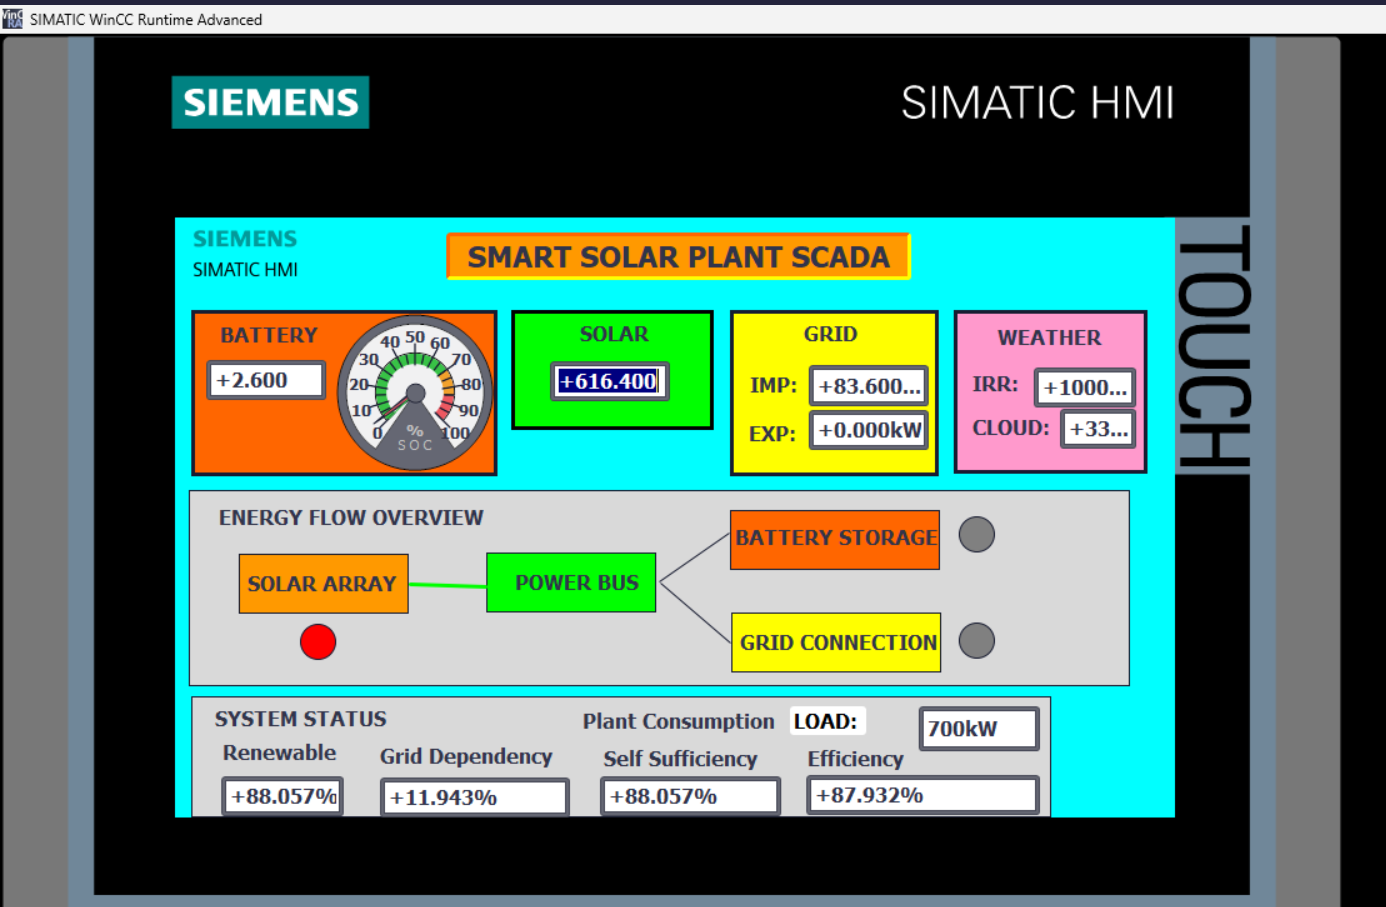
A full operator overview screen was designed and deployed in WinCC Advanced Runtime, bound via HMI tag connections to the live PLC data blocks. The screen aggregates all critical plant parameters into a single operator view, modelled after industrial solar SCADA conventions.
- Battery Panel — SOC gauge (0–100%) with live numeric readout, colour-coded by charge state
- Solar Panel — Live
Generated_kWnumeric display with dynamic background colour indicating generation intensity - Grid Panel — Separate import and export kW readouts with live values from
GridImport_kWandGridExport_kW - Weather Panel — Live irradiance (W/m²) and cloud factor percentage sourced from
DB_Weather.WeatherData - Energy Flow Overview — Animated topology diagram: Solar Array → Power Bus → Battery Storage / Grid Connection, with colour-changing flow lines and status indicator circles
- System Status Bar — Four live KPI fields: Renewable %, Grid Dependency %, Self Sufficiency %, Plant Efficiency %; sourced from
DB_Metrics - Plant Consumption (LOAD) — Live demand readout from
DB_Load.LoadData.Demand_kW
- All HMI tags bound directly to DB-level variables — no intermediate memory tags
- Animation properties configured using range-based value mapping (0 / 1) for boolean state visualisation
- Flow line colours change dynamically based on active routing commands
- SOC gauge needle driven by
DB_Energy.BatteryData.SOCwith 0–100 scale mapping
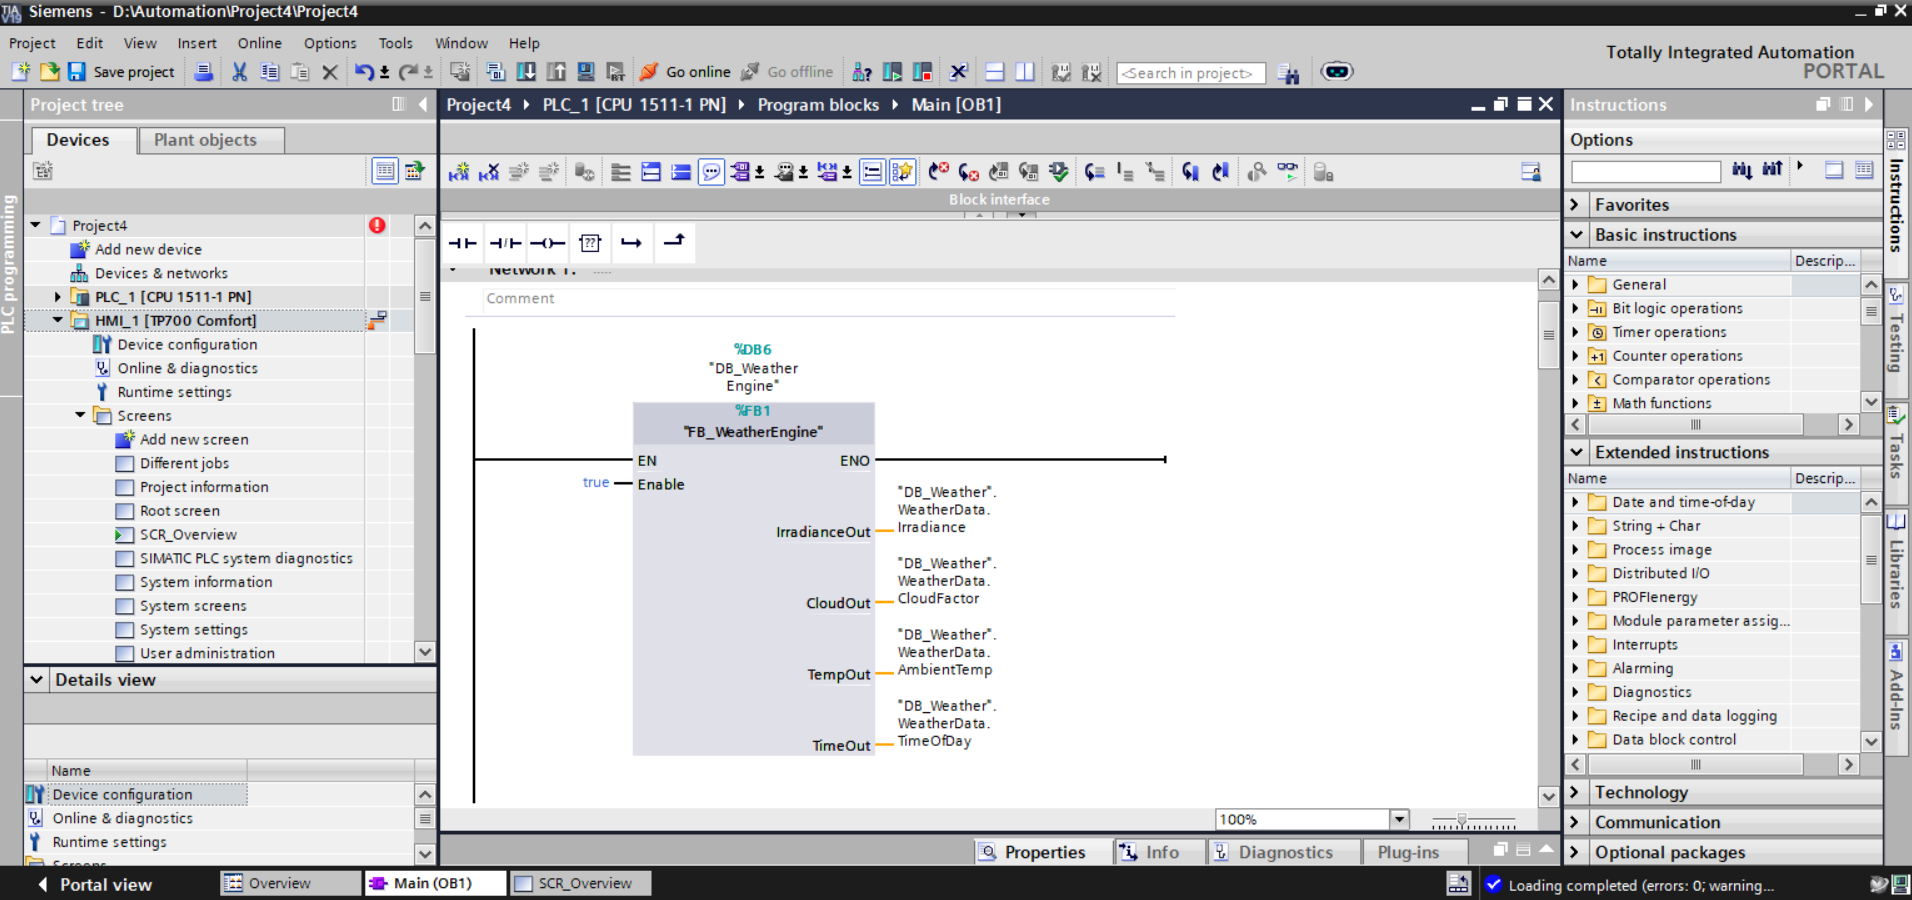
PLC Program Block Screenshots
Live TIA Portal screenshots captured from the active PLCSIM runtime session with all Phase 2 networks compiled and loaded. All blocks confirmed green-online with zero compile errors.
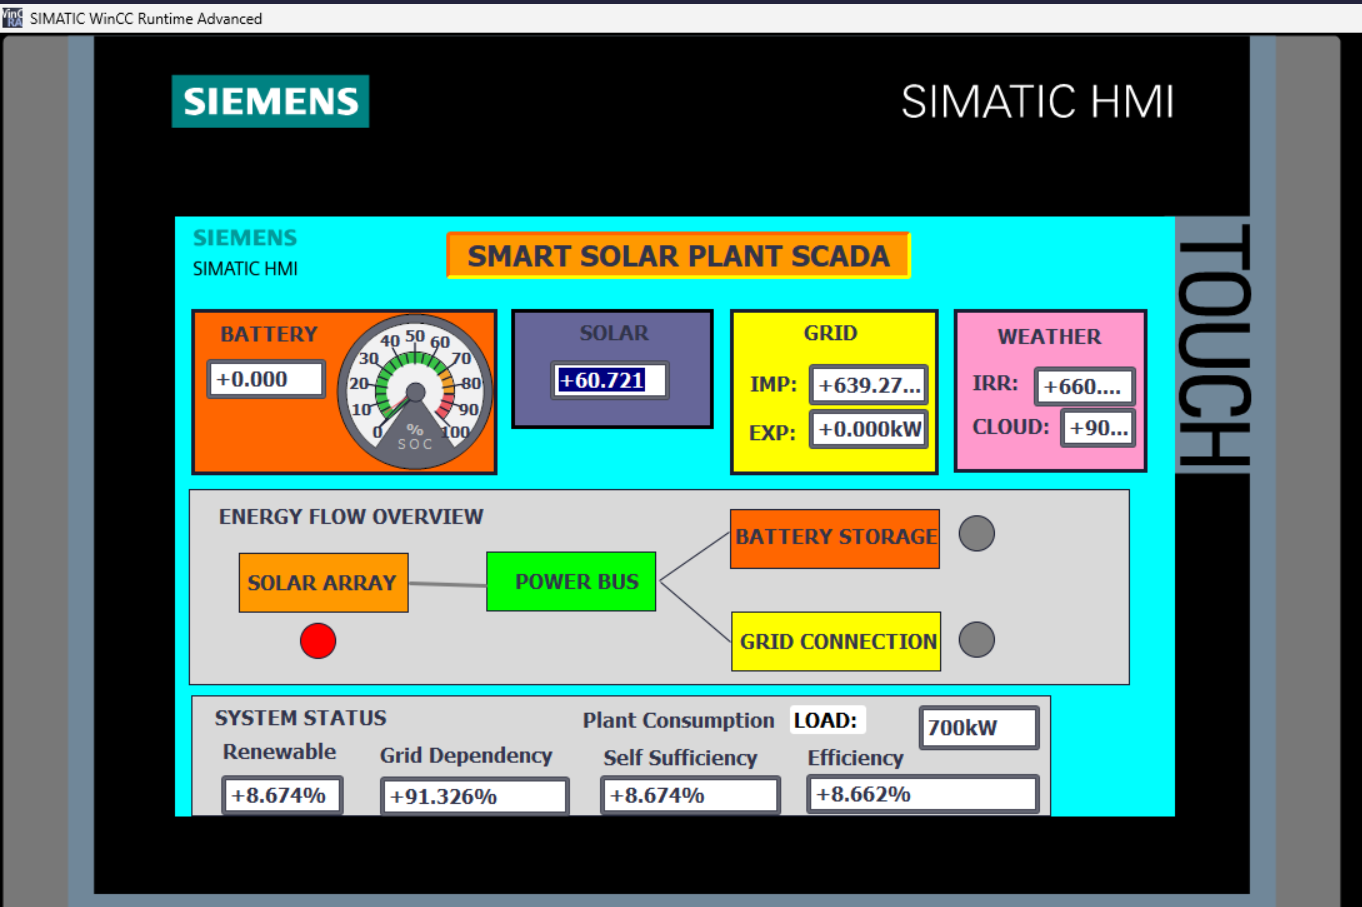
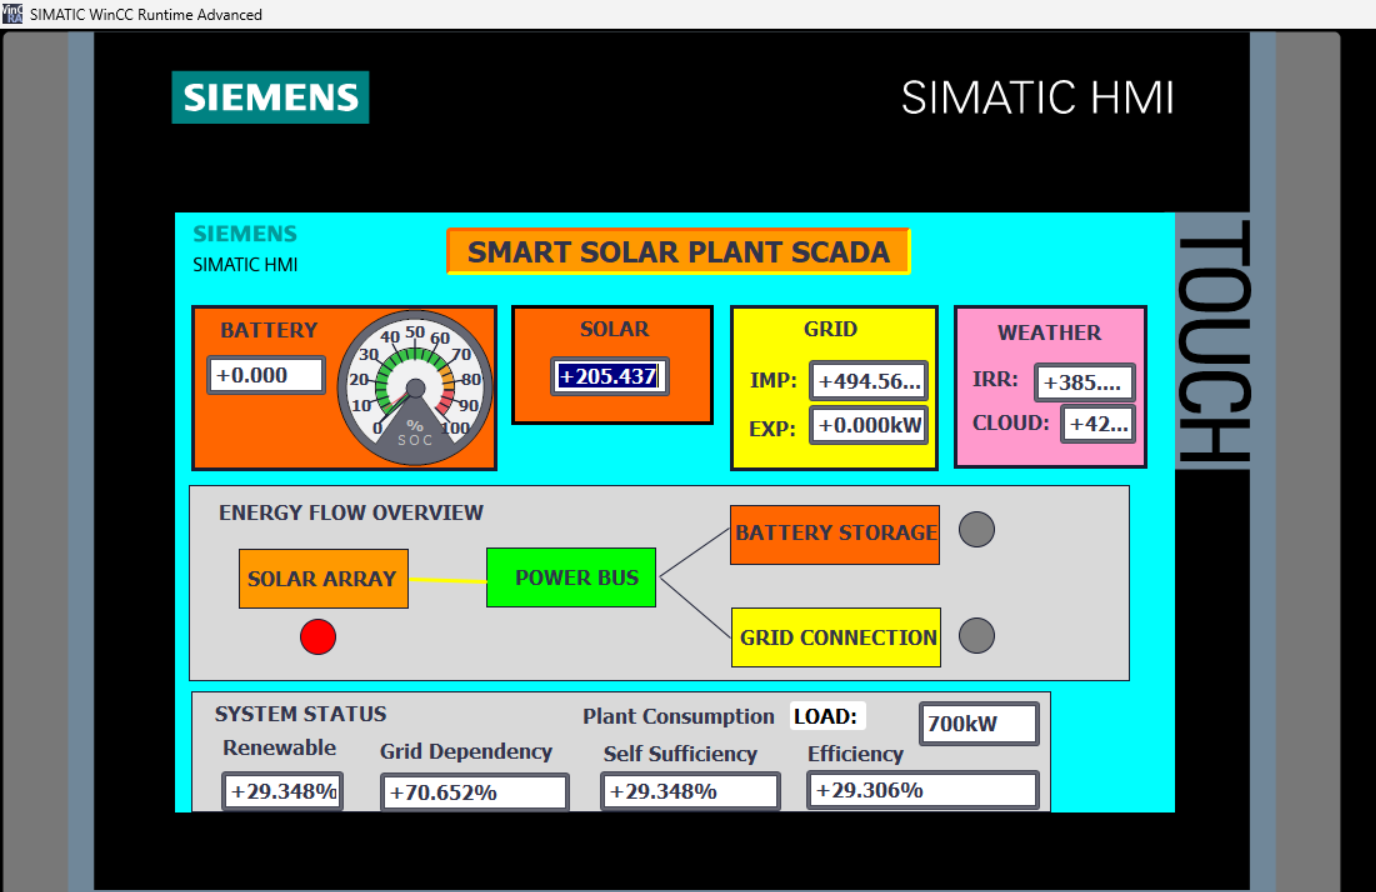
WinCC Advanced Runtime — Live HMI Screenshots
Three operational states captured from the live WinCC Advanced Runtime session during PLCSIM execution. Each state demonstrates a distinct energy routing condition as the simulated day cycle progresses and solar irradiance varies.
Virtual Commissioning & Runtime Status
All eight program blocks compiled to zero errors under TIA Portal V19 and loaded to the PLCSIM CPU 1511-1 PN virtual runtime. The WinCC Advanced HMI project was synchronised via the integrated HMI connection and launched in Runtime Advanced. All DB tag bindings confirmed active with live value updates visible across every HMI field during simulation.
Integration Issues & Resolutions
Several non-trivial engineering challenges were encountered and systematically diagnosed during Phase 2 implementation.
⚠ Issue 1 — WinCC Bit Animation Incompatibility
Single-bit animation mode was unavailable for certain WinCC object types, preventing direct boolean-driven colour changes on the energy flow diagram.
Resolution: Animation properties reconfigured to range-based value mapping — values 0 and 1 used as discrete range boundaries, replicating bit-driven behaviour within WinCC's supported animation framework.
⚠ Issue 2 — Zero-Value Efficiency Metrics (Scan Order Dependency)
All four efficiency KPI outputs remained fixed at 0.0 during initial commissioning. Root cause: the inline grid command resolution SCL (Network 6) had been placed after FB_EfficiencyMetrics in the OB1 execution sequence. The metrics block was reading stale, unresolved grid import values from the previous scan cycle.
Resolution: Network ordering restructured — grid SCL resolution moved above FB_EfficiencyMetrics. This enforced correct data dependency sequencing within the PLC scan, ensuring all upstream values were fully resolved before KPI computation executed.
⚠ Issue 3 — Conflicting Grid Control Authority (Dual Source Conflict)
The legacy FB_GridManager [FB4] from Phase 1 continued to write GridImport_kW and GridExport_kW concurrently with the new FB_EnergyRouter routing commands, producing indeterminate and oscillating SCADA values as two independent control sources competed for the same process variables.
Resolution: FB_GridManager removed from the OB1 execution sequence entirely. FB_EnergyRouter designated as the sole authoritative control source for all grid interaction variables, restoring deterministic and consistent energy routing behaviour.
⚠ Issue 4 — HMI Tag Binding Failures
Multiple WinCC HMI tags failed to resolve at runtime. Causes included incorrect DB variable path references, PLC-to-HMI tag name mismatches, and UDT structure path errors in some tag definitions.
Resolution: Affected tags rebuilt manually — HMI tags rebound directly to DB-level variables with fully qualified path syntax. Tag connections validated in the WinCC tag editor and confirmed live in Runtime Advanced before commissioning sign-off.
⚠ Issue 5 — WinCC Runtime System Screen Compilation Errors
WinCC generated compilation errors during Runtime launch related to invalid event handler references on auto-generated system screens.
Resolution: Invalid event references removed from the affected system screens. WinCC runtime compiled cleanly on subsequent build with no residual errors.
Engineering Lessons — Phase 2
✔ PLC Scan Order Is a First-Class Engineering Concern
The zero-value metrics issue demonstrated that data dependency sequencing in OB1 is as architecturally significant as the function block logic itself. In any system where calculated values feed subsequent calculations within the same scan, block execution order must be explicitly designed — not assumed.
✔ Single Ownership of Process Variables Is Non-Negotiable
Allowing two control blocks to write the same process variable simultaneously produces non-deterministic, unstable SCADA behaviour. Industrial automation systems must enforce strict single-source ownership for every controlled variable — particularly for grid interaction and power flow values where conflicting commands have real operational consequences.
✔ Modular FB Architecture Dramatically Reduces Debugging Scope
Each Phase 2 issue was isolated to a specific network or block within minutes, rather than requiring full-system analysis. The strict separation of concerns across weather, generation, storage, demand, routing, and metrics layers meant that each diagnosis affected one block — not a monolithic control program.
✔ HMI Tag Architecture Requires the Same Rigour as PLC Data Models
Multiple commissioning hours were consumed by incorrect HMI tag references rather than PLC logic errors. WinCC tag binding must be treated as a structured engineering activity — fully qualified DB paths, validated against the PLC data model, and tested independently of animation and screen logic.
✔ Industrial SCADA Systems Are Built in Disciplined Layers
This phase reinforced the architectural progression from monitoring → simulation → intelligent routing → metrics and diagnostics → operator visualisation. Each layer consumed verified outputs from the layer below it. That discipline is what allowed the system to scale from a static energy monitor into a responsive, decision-making plant management platform across two development phases.
Phase 2 System Capabilities
- Simulates dynamic plant load demand varying by time-of-day with peak demand period detection
- Executes intelligent per-scan energy routing — evaluating solar, demand, battery SOC, and peak mode simultaneously
- Issues autonomous charge, discharge, grid import, and grid export commands without operator input
- Resolves quantified grid import and export kilowatt values from boolean routing commands within the same PLC scan
- Computes four real-time KPIs: Renewable %, Grid Dependency %, Self Sufficiency %, Plant Efficiency %
- Drives a fully operational WinCC Advanced HMI with live data binding to all PLC data blocks
- Provides animated energy flow topology with dynamic colour-coded routing state indicators
- Demonstrates three distinct operational states: high solar, cloud-dominant, and partial generation
- Maintains zero compile errors across all eight program blocks under TIA Portal V19
- Operates entirely within the PLCSIM virtual commissioning environment — no physical hardware required
Development Roadmap
✅ Phase 1 — Core Simulation
Weather engine, solar generation, BESS, grid manager, PLCSIM virtual commissioning. Complete.
✅ Phase 2 — Advanced Energy Management
Dynamic load demand, intelligent energy routing, efficiency KPIs, WinCC Advanced SCADA HMI. Complete.
🚨 Phase 3 — Alarm & Fault System
Inverter fault simulation, overtemperature alarms, grid instability events, alarm acknowledgment workflows, UDT_Alarm integration.
Phase 4 — Historical Trends
Energy historian, 24h accelerated playback, trend logging and SCADA reporting dashboards.
Phase 5 — Hybrid Microgrid
Wind turbine simulation, diesel generator backup logic, automatic transfer switching and source priority management.
Phase 6 — Advanced Control
Full plant state machines, PID thermal regulation, predictive energy optimisation, operational recipes.