Case Study: Tank Level Trend Analysis
Real-time process monitoring and historical trend analysis using Ignition Perspective, Tag History, and time-series data visualisation for industrial SCADA applications
Troubleshooting (Ignition Gateway)
- Step 1: Press Win + R → type
services.msc - Step 2: Locate Ignition Gateway
- Step 3: Start or Restart the service
The Ignition Gateway is the centralised server process that manages all platform services, including the Tag History database, Perspective session handling, OPC-UA communication, and Designer connectivity. If the Gateway service is not running, all dependent subsystems — including tag subscriptions, historical logging, and live Perspective views — will be unavailable or return connection errors.
Pro tip: Configure the Gateway service startup type to Automatic in the Windows Services manager to ensure the platform initialises on system boot, eliminating manual intervention after restarts or power events.
Project Overview
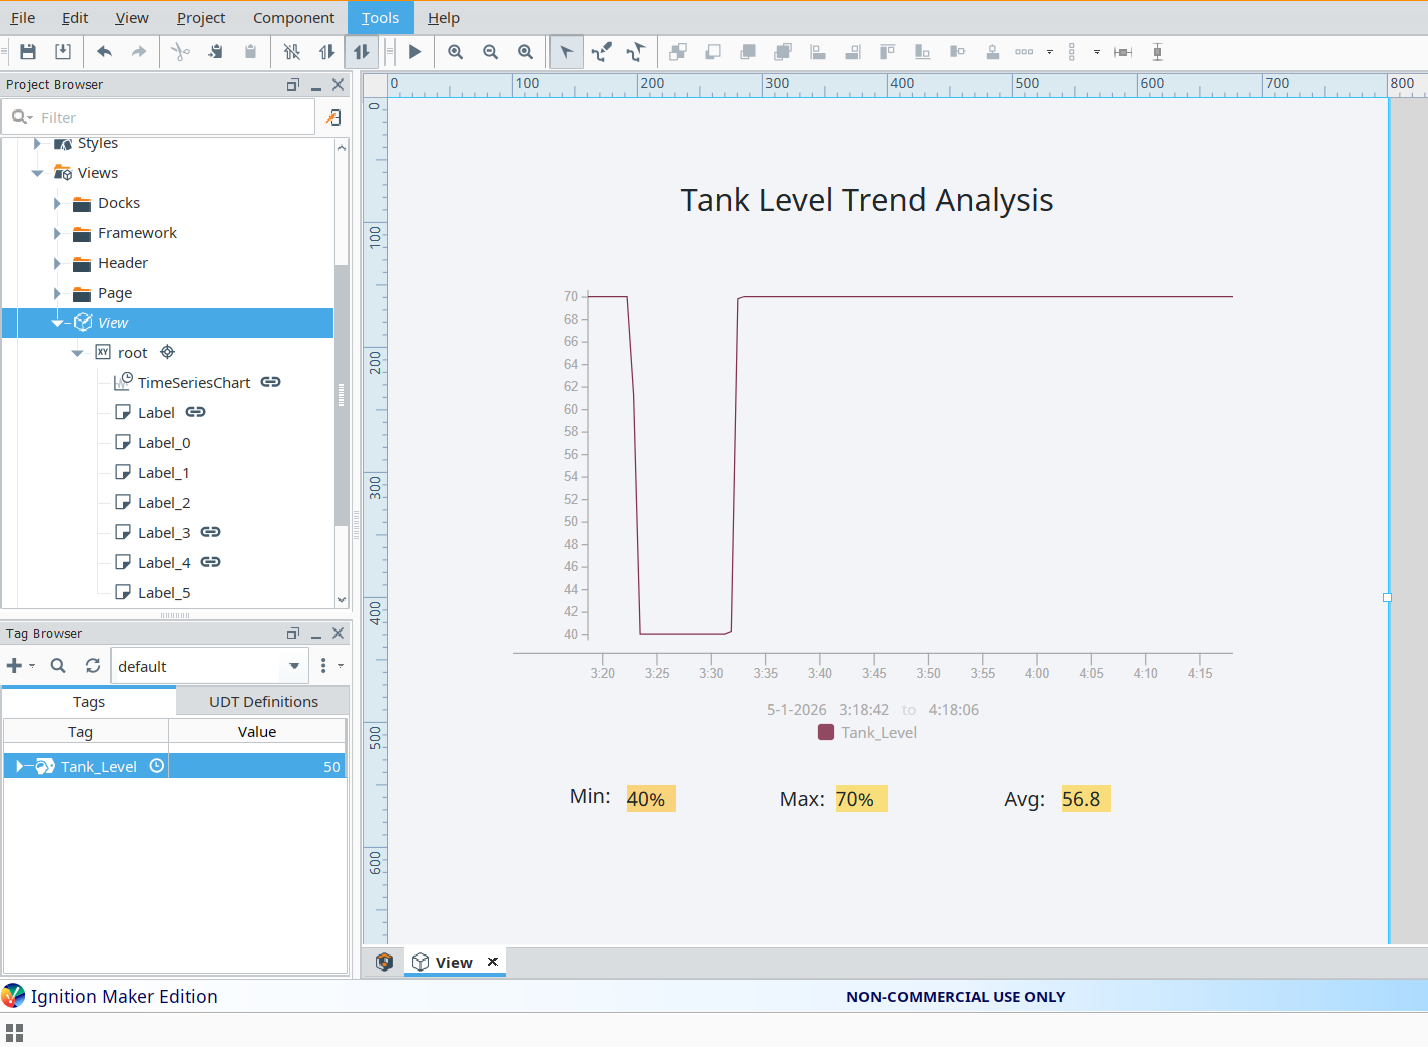
This project implements a real-time and historical tank level monitoring solution within the Ignition 8.1 SCADA platform using the Perspective module. A simulated process tag representing tank fill level is configured with Tag History enabled, allowing the system to persist time-stamped process values to the internal historian database. The Perspective view presents this data through a Time Series Chart component, with statistical aggregations — minimum, maximum, and rolling average — computed directly from historised tag data and surfaced alongside the trend for operator reference.
Problem
Process operators monitoring tank levels require more than instantaneous tag readings to manage operations effectively. Without historical trend visibility, transient anomalies, gradual drift, or cyclical fill-and-drain patterns go undetected until they escalate into operational incidents. Raw real-time values provide no context for whether a current reading represents normal operating range, a developing fault condition, or an outlier event. A SCADA-integrated historian combined with statistical aggregation and time-series visualisation is required to transform raw process data into actionable operational insight.
Solution
- Historised tag: Tank_Level — configured with Tag History enabled, logging process values at a defined sample rate to Ignition's internal historian
- Time Series Chart component bound to Tag History query, rendering historical trend data across a configurable time window
- Statistical aggregations — Minimum, Maximum, and Average — computed via Tag History query in Calculations mode and displayed as live-updating numeric indicators
- Perspective view configured for automatic refresh, ensuring the display reflects the current historian state without requiring manual operator interaction
- SCADA-aligned layout designed around operator readability standards: clear hierarchy, minimal visual noise, and high-contrast data presentation
The combined graphical and numerical presentation allows operators to assess both the shape of process behaviour over time and specific statistical bounds, enabling faster identification of abnormal operating conditions and more informed process decisions.
Engineering Decisions
- Tag History was selected over real-time tag binding to enable historian-backed trend queries, supporting time-range selection and aggregation — capabilities not available through live tag subscriptions alone
- Calculations mode was used for min/max/average extraction rather than scripted post-processing, leveraging Ignition's native historian aggregation engine for efficiency and reduced binding complexity
- The Perspective layout was intentionally kept minimal to conform to established HMI/SCADA usability principles, prioritising data clarity and operator situational awareness over decorative elements
Data Configuration
- Tag: Tank_Level — FLOAT process value representing simulated tank fill percentage
- History Enabled: Yes — tag configured to log to the Ignition internal historian at a periodic sample rate
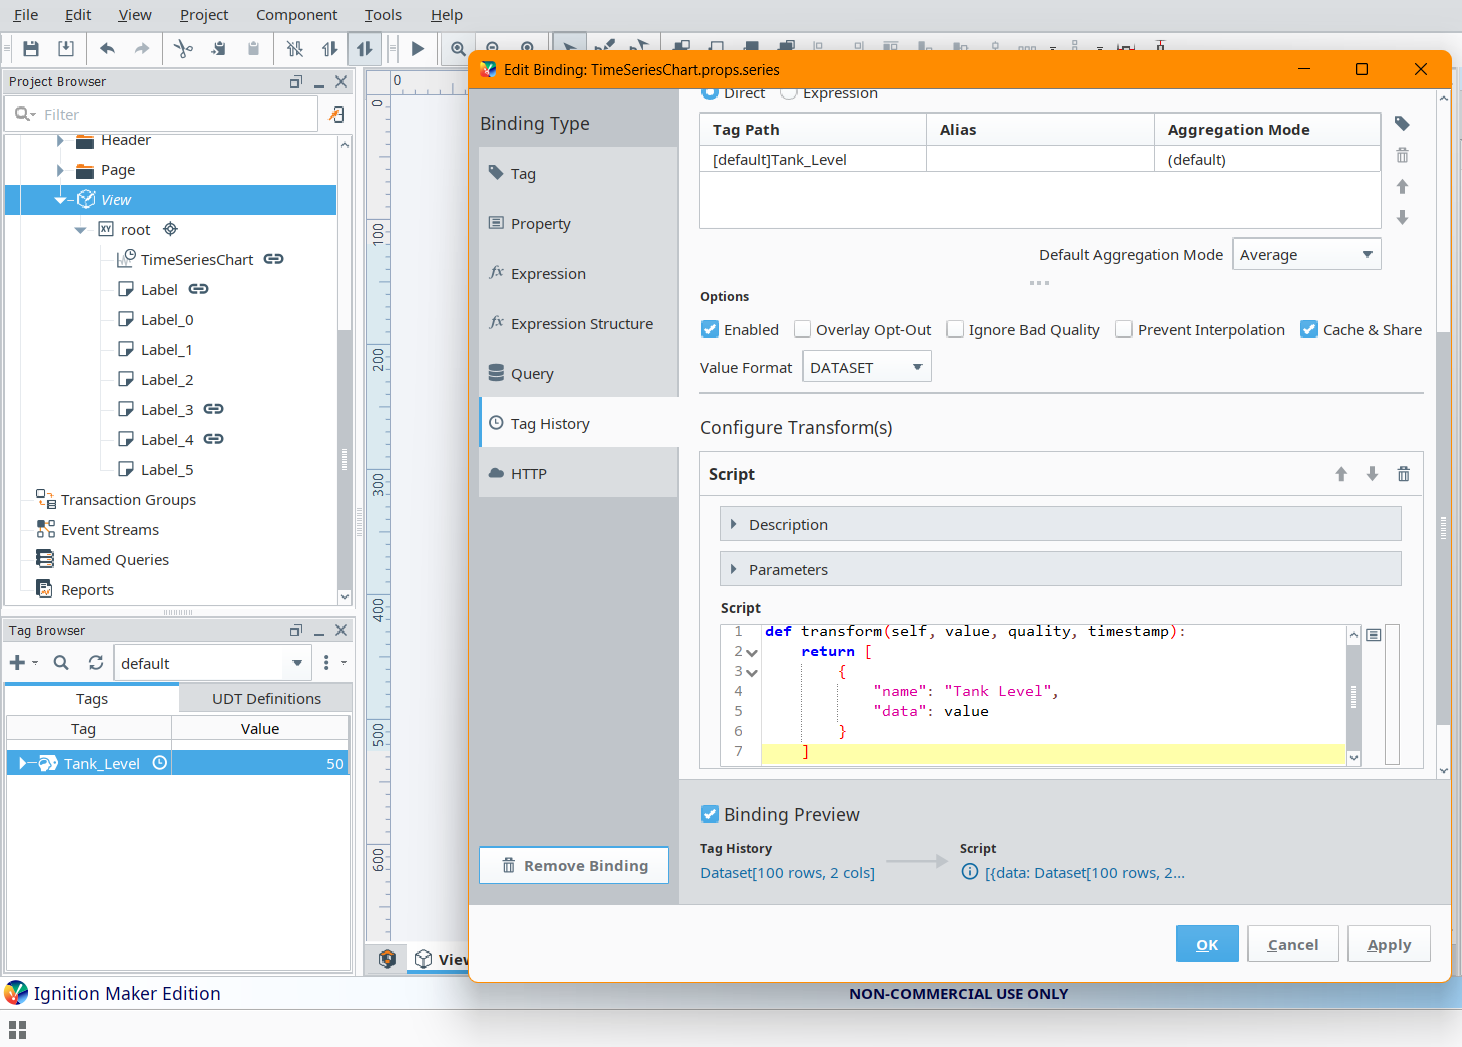
- Return Format: Dataset — Tag History query returns a structured dataset consumed by the Time Series Chart component
- Calculations: Minimum, Maximum, Average — aggregated over the active query time range using Ignition's built-in historian calculation engine
Historical data is queried over a user-defined or fixed time range and processed entirely within Perspective component bindings, requiring no external scripting or database calls. This approach keeps the data pipeline within Ignition's managed historian infrastructure, ensuring consistency between the chart display and the aggregated statistical outputs.
Project Screenshots
Testing & Debugging
- Verified Tag History logging by confirming time-stamped records were being written to the historian at the configured sample interval, using the Ignition Gateway's Tag History status panel
- Diagnosed and resolved Gateway service connectivity failures that prevented Perspective sessions and Tag History queries from initialising correctly
- Identified and corrected a binding type mismatch in which the Time Series Chart component expected a Dataset return format but received a raw Array — resolved by adjusting the Tag History query return type configuration
- Validated statistical calculation outputs by cross-referencing historian query results against manually inspected tag value logs to confirm aggregation accuracy
Challenges Faced
The primary platform issue encountered was the Ignition Gateway service not running on system startup, which caused all dependent subsystems — including Tag History, Perspective session management, and Designer connectivity — to fail silently or return uninformative connection errors. Root cause analysis identified the service startup type as Manual, requiring it to be reconfigured to Automatic to ensure reliable platform initialisation.
A secondary technical challenge arose from Ignition's distinction between Dataset and Array return formats in Tag History query bindings. The Time Series Chart component requires a structured Dataset input to correctly map time-value pairs to chart series. Binding a raw Array return to this component produced no visible data and no explicit error, requiring methodical investigation of the binding configuration and component data structure expectations to identify and resolve the mismatch.
This project reinforced a practical understanding of Ignition's layered architecture: the Gateway as the managed runtime responsible for historian storage, tag execution, and communication services; and the Designer as the configuration and visualisation layer dependent on a healthy Gateway connection to function correctly.
Key Learning Outcomes
- Ignition Perspective application development and component-based UI composition
- Tag History configuration, sample rate tuning, and historian query construction
- Time Series Chart data structures, binding types, and Dataset vs Array format handling
- Debugging Perspective bindings, diagnosing transform errors, and validating query outputs
- SCADA-aligned HMI design principles: operator-centred layout, data hierarchy, and readability standards
Tools Used
- Ignition 8.1 (Maker Edition) — Inductive Automation SCADA/HMI platform
- Perspective Module — Browser-based, responsive HMI development environment within Ignition
- Tag History System — Ignition's integrated historian for time-series process data storage and retrieval
- Industrial HMI Design Principles — Operator-centred layout conventions aligned with ISA-101 HMI design standards