🚀 Mission Control Dashboard (SCADA)
Multi-system industrial monitoring dashboard engineered in Ignition Perspective, implementing real-time tag binding, structured alarm management, alarm-to-page navigation workflows, and a scalable multi-page HMI architecture across heterogeneous industrial subsystems.
Project Overview
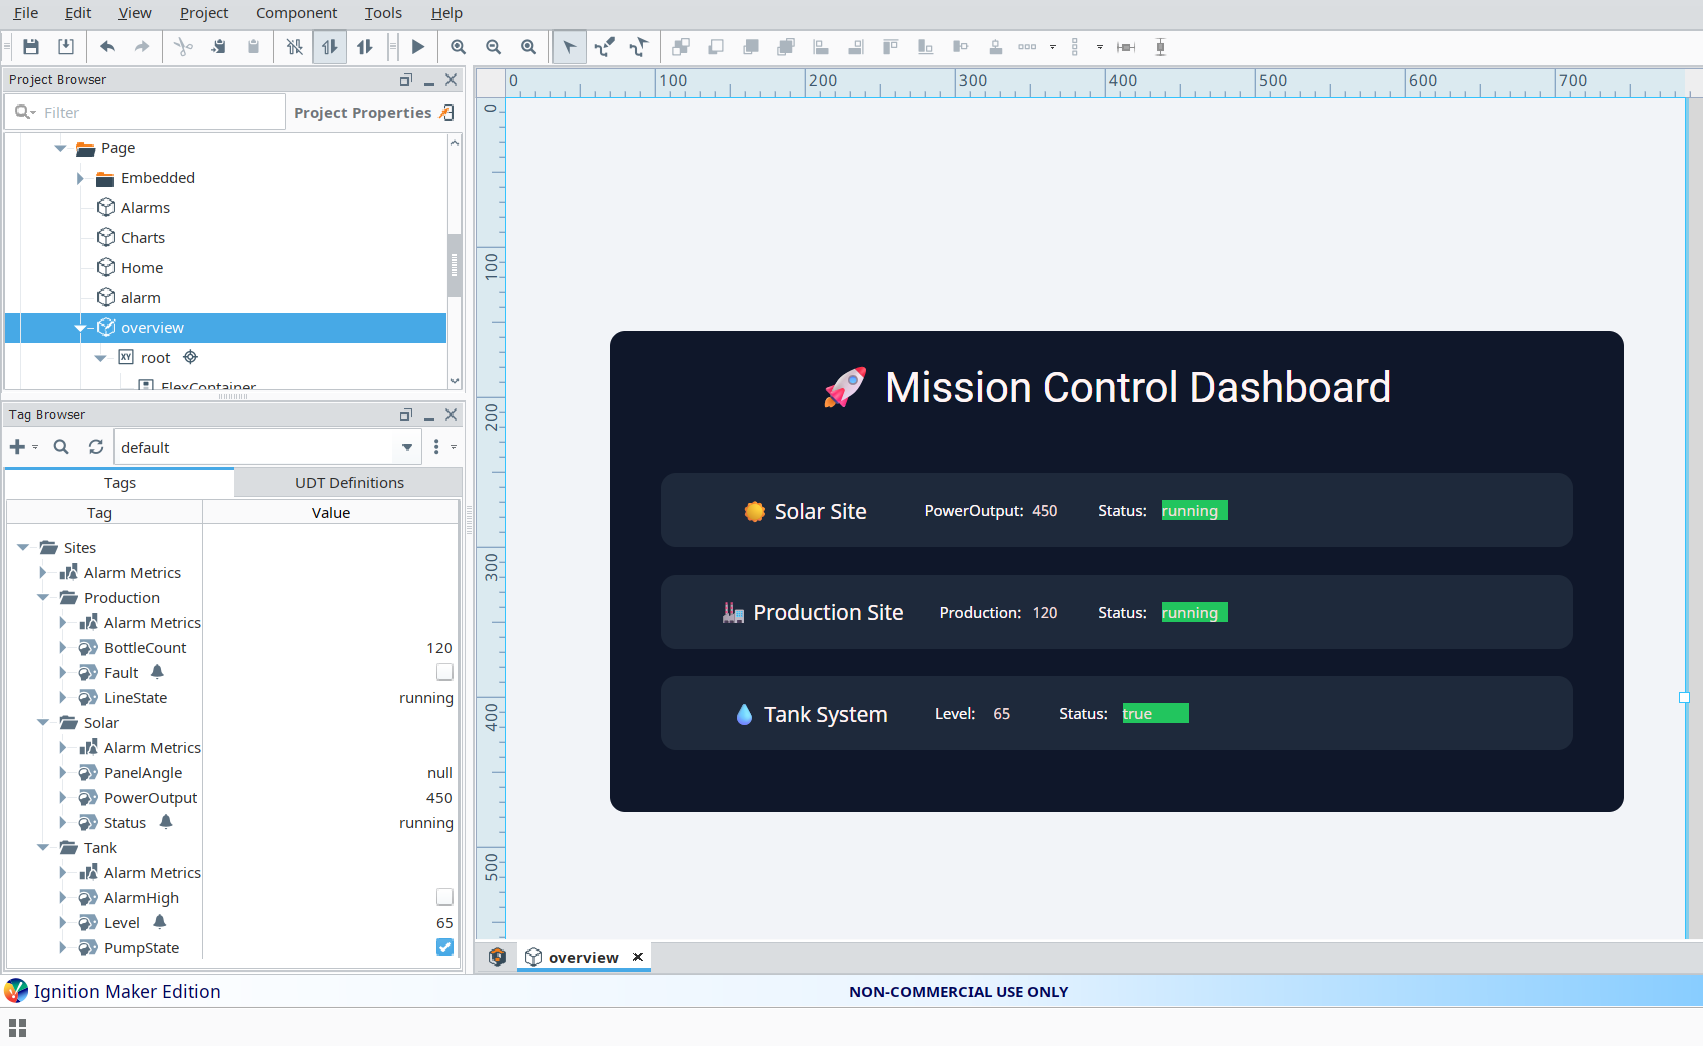
This project delivers a centralised SCADA-style supervisory dashboard designed to provide unified real-time operational visibility across three discrete industrial subsystems: Solar generation, bottling Production lines, and Tank level management. The interface is architected around Ignition Perspective's tag binding engine, leveraging expression bindings for dynamic state-driven UI rendering, a structured alarm pipeline for fault detection and acknowledgment, and an event-driven navigation system linking alarm records directly to their associated system views. The architecture reflects industrial HMI design principles, prioritising operator response time, data integrity, and fault isolation across a unified control surface.
Problem
Industrial environments operating across multiple discrete subsystems — each with independent data sources, fault domains, and operational states — impose significant cognitive overhead on operators when monitoring tools are fragmented across disconnected screens or require manual context switching. The engineering requirement was to consolidate real-time system status, active alarm telemetry, and fault condition indicators into a single, coherent supervisory interface. The solution needed to support immediate fault identification, alarm-driven navigation to the relevant subsystem view, and dynamic UI state updates without operator-initiated page refreshes or manual data polling.
Solution
- Real-time expression bindings to live tag provider data, enabling zero-latency UI state synchronisation with underlying system values
- Dynamic status indicator components with conditional color logic driven by tag state expressions — resolving to distinct visual states for Running, Fault, and Idle conditions
- Alarm table implementation using Perspective Table with script transform post-processing, supporting active and acknowledged alarm filtering with structured alarm metadata
- Row-selection event handler enabling direct alarm-to-system-page navigation, passing alarm name and active state as URL parameters to the target view
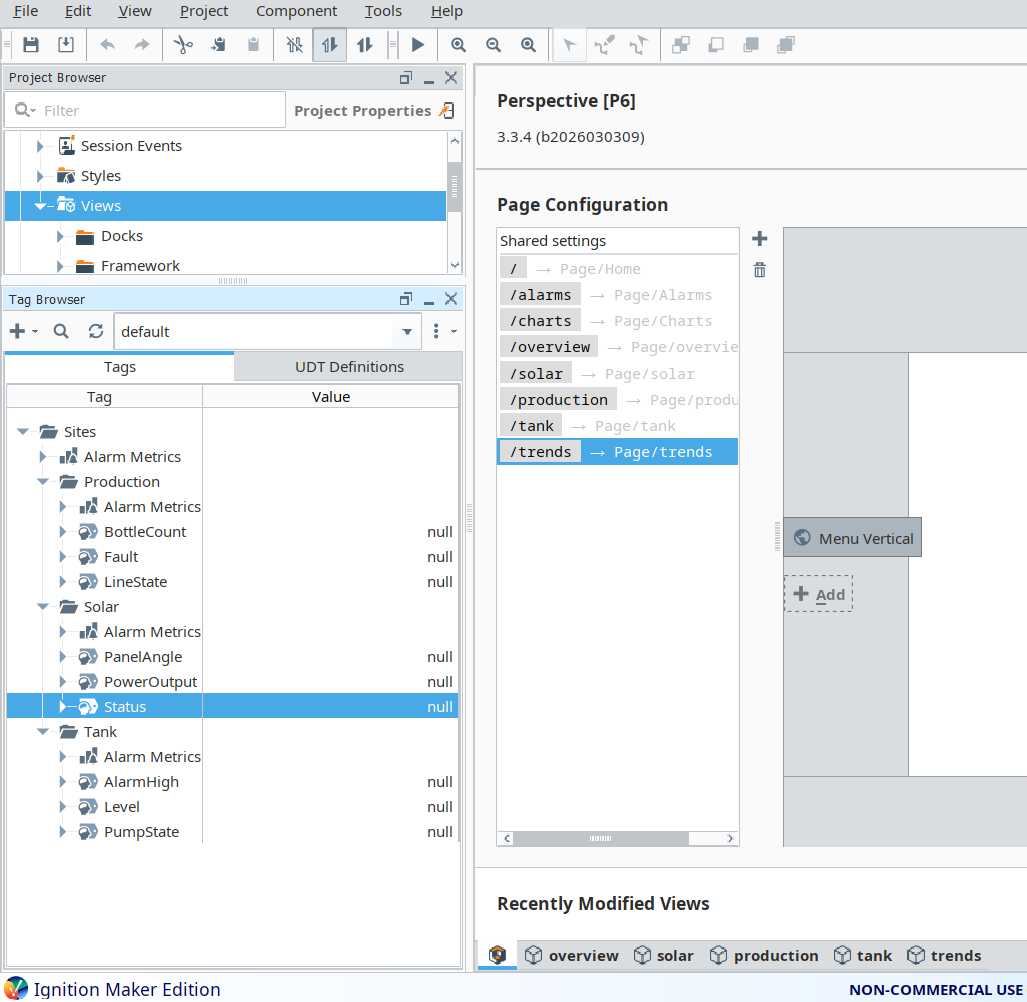
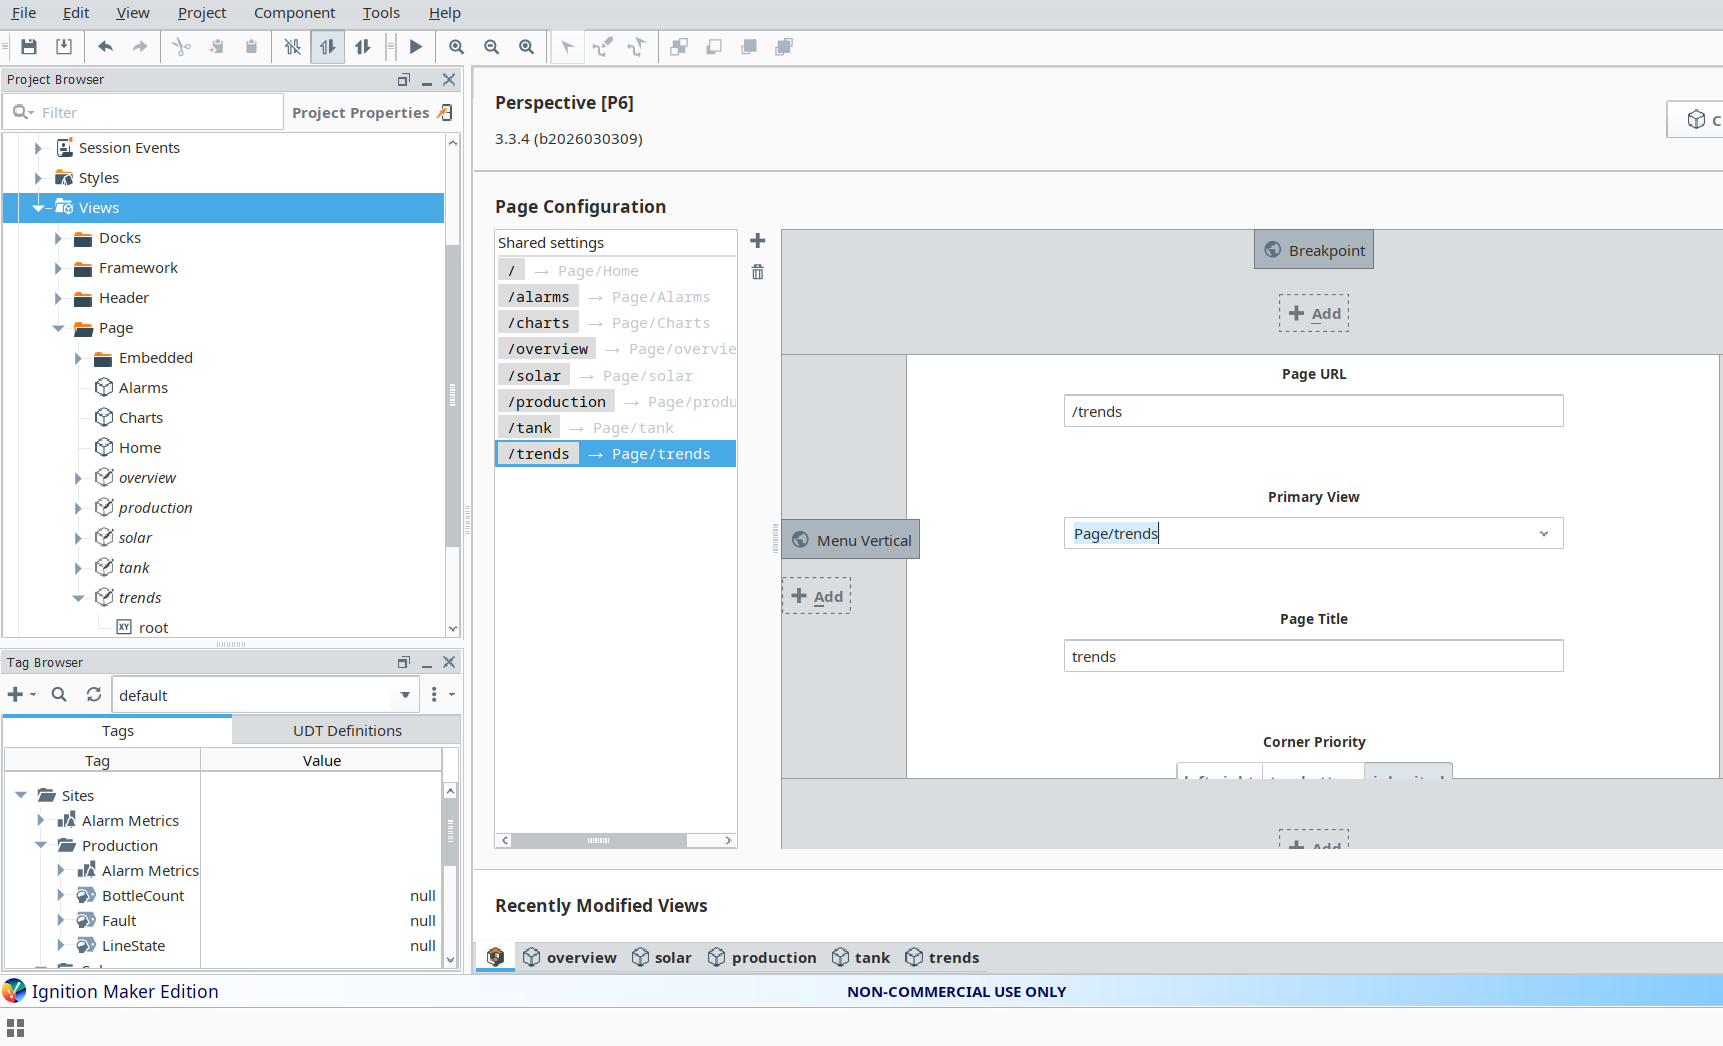
- Multi-page architecture spanning Overview, Solar, Production, Tank, and Trends pages, with consistent navigation and cross-page parameter passing
- Reusable FlexContainer-based card layout components providing a responsive, maintainable UI structure decoupled from individual tag bindings
System Architecture
Sites/
├── Solar/
│    ├── PowerOutput         -- REAL, kW generation value
│    ├── Status              -- STRING, operational state tag
│
├── Production/
│    ├── BottleCount         -- INTEGER, cumulative unit counter
│    ├── LineState           -- STRING, drive/conveyor state
│    ├── Fault               -- BOOL, fault condition flag
│
├── Tank/
│    ├── Level               -- REAL, percentage fill level
│    ├── PumpState           -- BOOL, pump run status
Key Logic Example (Status Coloring)
if(lower({[default]Sites/Production/LineState})="running","#22c55e",
if(lower({[default]Sites/Production/LineState})="fault","#ef4444","#6b7280"))
This expression binding evaluates the live LineState tag value on each scan cycle,
normalising the string to lowercase to ensure case-insensitive matching across operator-entered and
PLC-written values. The ternary chain resolves to a green hex value for running, red for fault, and
a neutral grey for all idle or undefined states — driving the background color property of the status
indicator component without requiring a script transform or additional tag logic.
Alarm Integration
The alarm management layer was implemented using a Perspective Table component backed by a script
transform that post-processes the raw alarm dataset into a structured, navigation-ready format.
Each alarm record is enriched with a target page path and system identifier, enabling
the Table's row selection event handler to resolve the appropriate navigation destination at runtime.
The system.perspective.navigate call passes highlight and active
parameters to the destination page, allowing the receiving view to pre-filter or highlight the
relevant component without additional operator input.
system.perspective.navigate(
    page=data["target"],
    params={
        "highlight": data["Name"],
        "active":    data["isActive"]
    }
)
Project Screenshots
Challenges Faced
- Resolving FlexContainer layout behaviour differences from coordinate-based positioning, particularly managing component alignment and responsive sizing across variable-width subsystem cards
- Debugging Perspective expression binding evaluation order and understanding scan-cycle timing when multiple dependent bindings referenced the same upstream tag
- Structuring the alarm dataset correctly for the Perspective Table component, including aligning column schema output from the script transform with the Table's expected dataset format
- Implementing reliable row-event navigation from the alarm table, including handling edge cases where alarm records lacked a resolvable target page path
Key Learning Outcomes
- Production SCADA HMI design using Ignition Perspective — component binding patterns, FlexContainer layout architecture, and multi-page navigation with parameter passing
- Tag-based data modelling for multi-subsystem industrial environments, including namespace hierarchy design and tag type selection for different signal classes
- Dynamic UI state rendering via expression bindings — evaluating tag values inline to drive component style properties without requiring scripting infrastructure
- Event-driven navigation workflows integrating alarm metadata with page routing, enabling fault-to-view drill-down from a unified supervisory surface
- Alarm system integration within Perspective — dataset processing, script transform post-enrichment, and acknowledgment state filtering
Tools Used
- Ignition Perspective — Web-based HMI framework for SCADA operator interface design, component binding, and multi-page application architecture
- Tag Browser and Memory Tags — Real-time tag provider used for data simulation, subsystem state modelling, and expression binding validation during development
- Expression Bindings and Script Transforms — Core Ignition binding mechanisms used to drive dynamic UI rendering and alarm dataset post-processing